| Red | Green | Blue | |
| z | 17.64 | ||
| znorm | Inf | ||
| sky | -Inf | -Inf | -Inf |
| S/N | 36.2 | 57.0 | 63.9 |
| S/N(c) | 36.2 | 57.0 | 63.9 |
| SN(E/C) |
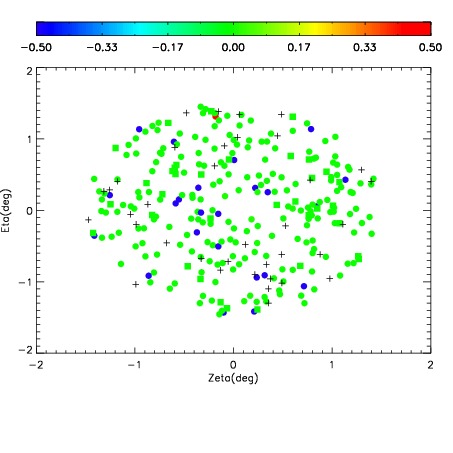
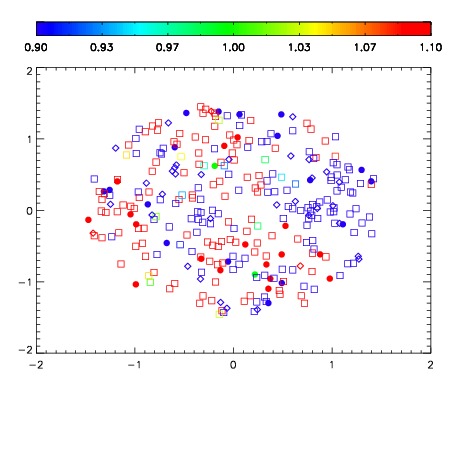
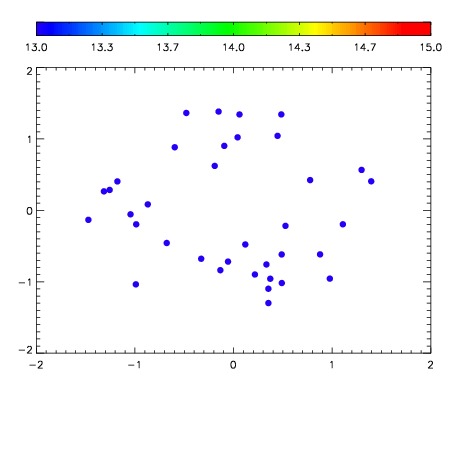

| Frame | Nreads | Zeropoints | Mag plots | Spatial mag deviation | Spatial sky 16325A emission deviations (filled: sky, open: star) | Spatial sky continuum emission | Spatial sky telluric CO2 absorption deviations (filled: H < 10) | |||||||||||||||||||||||
| 0 | 0 |
|
|
|
|
|
|
| IPAIR | NAME | SHIFT | NEWSHIFT | S/N | NAME | SHIFT | NEWSHIFT | S/N |
| 0 | 12320017 | 0.488632 | 0.00000 | 175.220 | 12320011 | 0.00000 | 0.488632 | 179.641 |
| 1 | 12320013 | 0.487198 | 0.00143400 | 182.656 | 12320015 | 0.000579891 | 0.488052 | 183.439 |
| 2 | 12320012 | 0.487000 | 0.00163200 | 180.705 | 12320014 | 0.000985037 | 0.487647 | 180.682 |
| 3 | 12320016 | 0.488580 | 5.20051e-05 | 172.860 | 12320018 | 0.000257281 | 0.488375 | 179.079 |