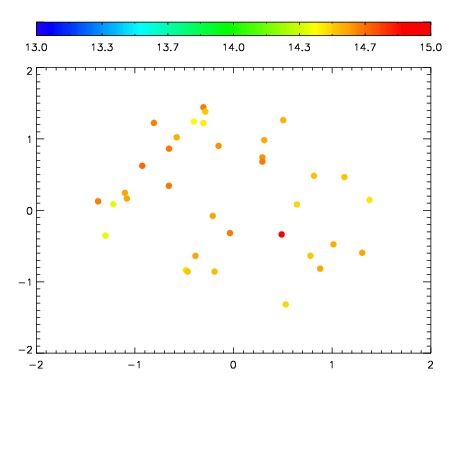
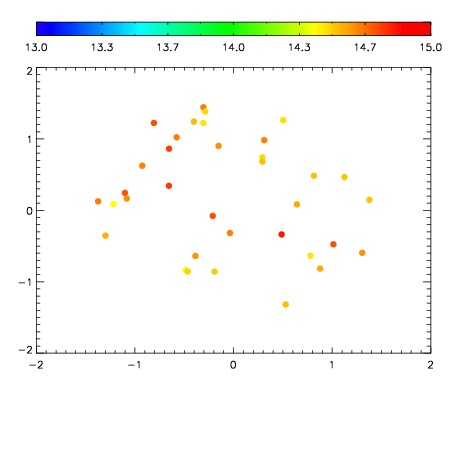
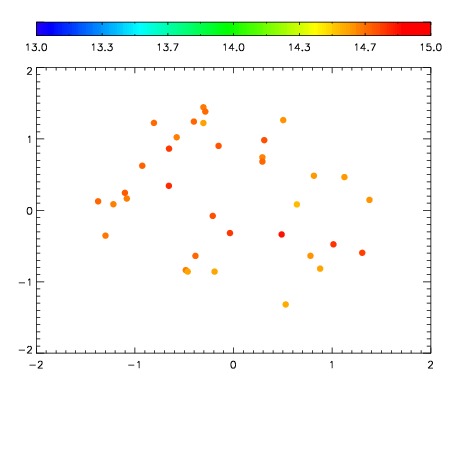
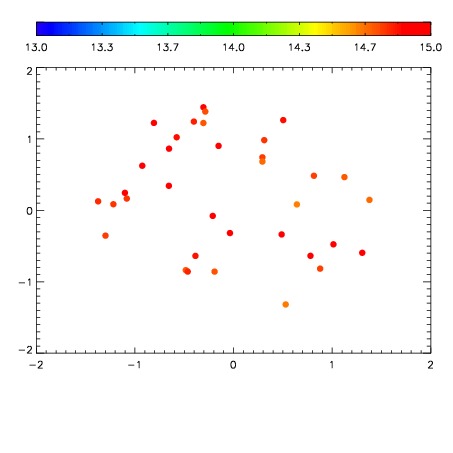
| Frame | Nreads | Zeropoints | Mag plots
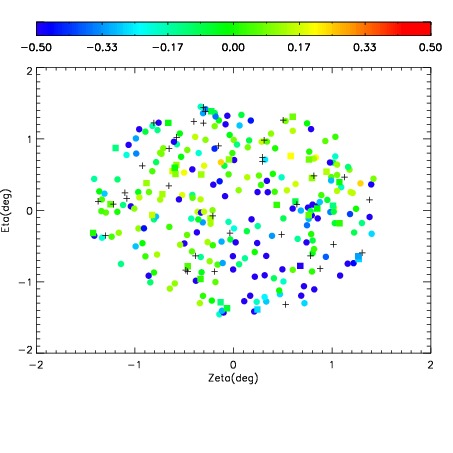
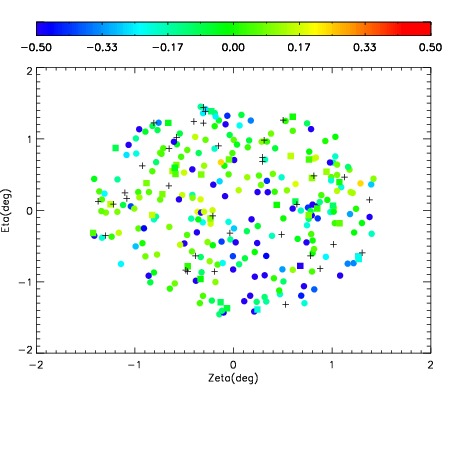
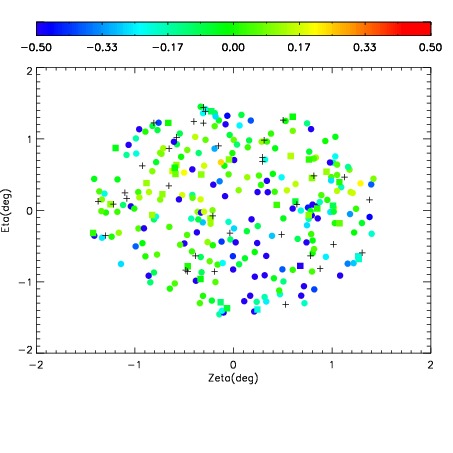
| Spatial mag deviation
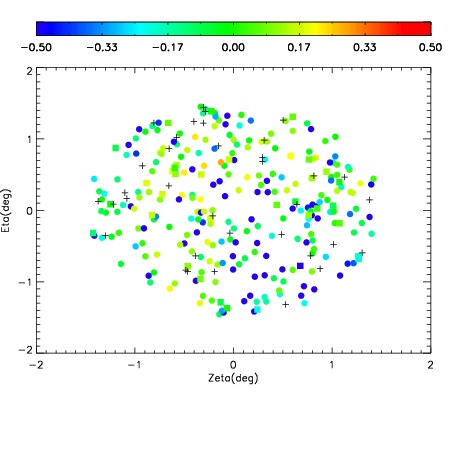
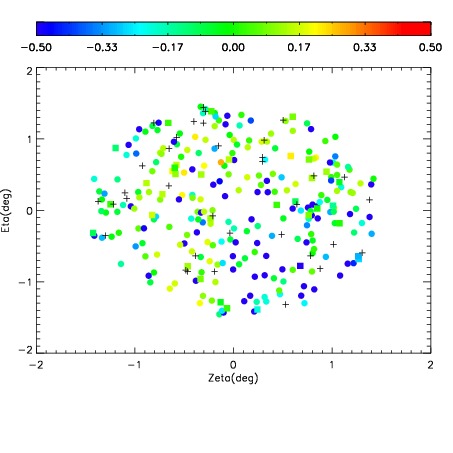
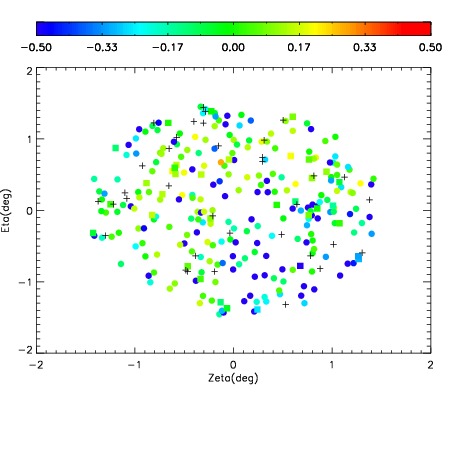
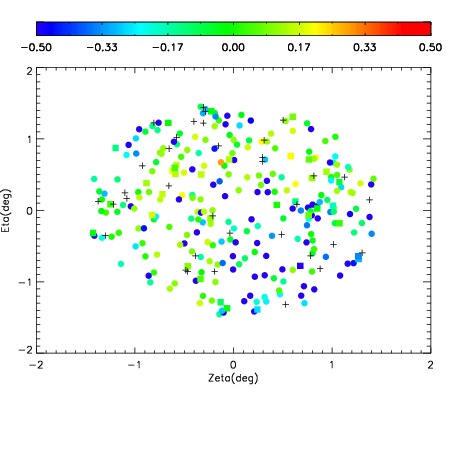
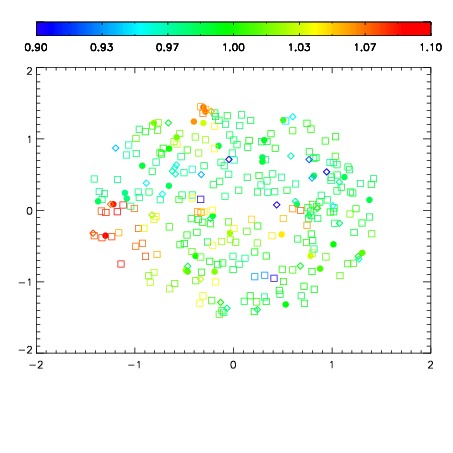
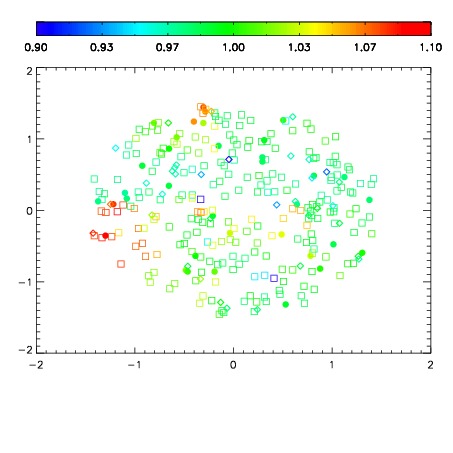
| Spatial sky 16325A emission deviations (filled: sky, open: star)
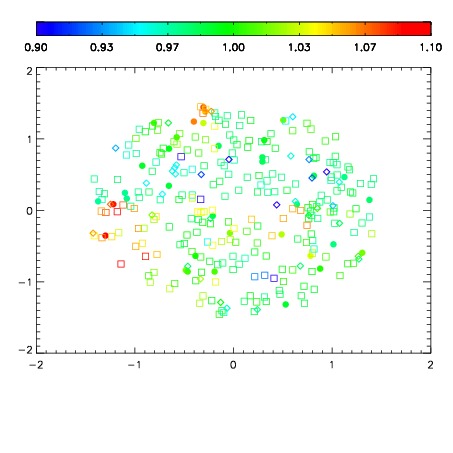
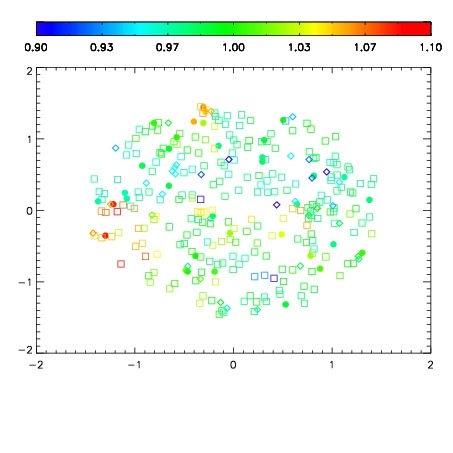
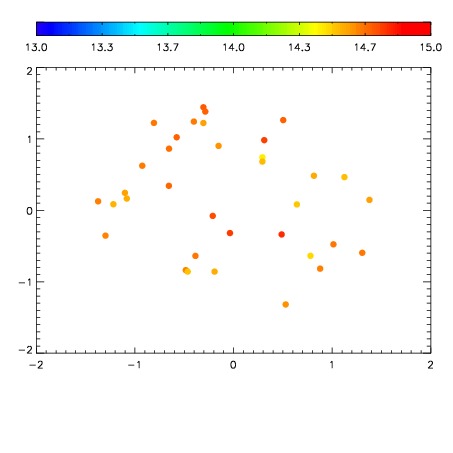
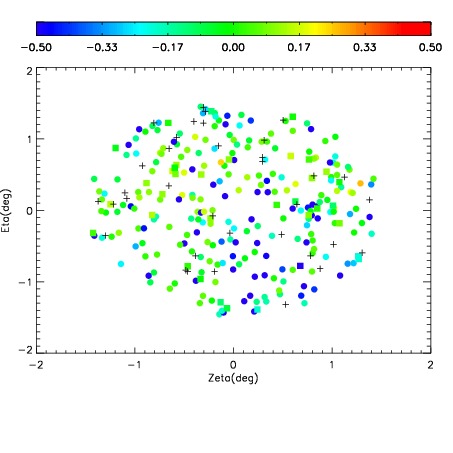
| Spatial sky continuum emission
| Spatial sky telluric CO2 absorption deviations (filled: H < 10)
|
| 12030037
| 47
| | Red | Green | Blue
| | z | | 18.69
| | znorm | | 14.51
| | sky | 14.9 | 14.6 | 14.5
| | S/N | 13.7 | 22.2 | 23.6
| | S/N(c) | 11.8 | 20.1 | 22.2
| | SN(E/C) 0.37
|
| 
| 
| 
| 
| 
|
| 12030038
| 47
| | Red | Green | Blue
| | z | | 18.73
| | znorm | | 14.55
| | sky | 15.0 | 14.6 | 15.0
| | S/N | 14.1 | 22.6 | 24.7
| | S/N(c) | 12.3 | 20.7 | 23.2
| | SN(E/C) 0.35
|
| 
| 
| 
| 
| 
|
| 12030039
| 47
| | Red | Green | Blue
| | z | | 18.70
| | znorm | | 14.52
| | sky | 14.8 | 14.7 | 15.1
| | S/N | 13.4 | 21.9 | 23.8
| | S/N(c) | 11.6 | 19.9 | 22.2
| | SN(E/C) 0.36
|
| 
| 
| 
| 
| 
|
| 12030040
| 47
| | Red | Green | Blue
| | z | | 18.70
| | znorm | | 14.52
| | sky | 14.9 | 14.8 | 14.8
| | S/N | 13.2 | 21.7 | 23.5
| | S/N(c) | 11.4 | 19.7 | 22.0
| | SN(E/C) 0.36
|
| 
| 
| 
| 
| 
|
| 12030041
| 47
| | Red | Green | Blue
| | z | | 18.65
| | znorm | | 14.47
| | sky | 14.8 | 14.6 | 14.8
| | S/N | 12.5 | 20.9 | 22.6
| | S/N(c) | 10.9 | 19.0 | 21.0
| | SN(E/C) 0.38
|
| 
| 
| 
| 
| 
|
| 12030042
| 47
| | Red | Green | Blue
| | z | | 18.25
| | znorm | | 14.07
| | sky | 14.9 | 14.7 | 14.9
| | S/N | 9.3 | 16.5 | 17.5
| | S/N(c) | 7.9 | 14.7 | 16.2
| | SN(E/C) 0.45
|
| 
| 
| 
| 
| 
|
| 12030043
| 47
| | Red | Green | Blue
| | z | | 18.33
| | znorm | | 14.15
| | sky | 14.9 | 14.7 | 15.0
| | S/N | 10.0 | 17.6 | 18.8
| | S/N(c) | 8.5 | 15.8 | 17.4
| | SN(E/C) 0.45
|
| 
| 
| 
| 
| 
|
| 12030044
| 47
| | Red | Green | Blue
| | z | | 18.44
| | znorm | | 14.26
| | sky | 15.0 | 14.9 | 15.3
| | S/N | 10.9 | 18.7 | 20.4
| | S/N(c) | 9.4 | 16.9 | 18.9
| | SN(E/C) 0.40
|
| 
| 
| 
| 
| 
|