| Red | Green | Blue | |
| z | 17.64 | ||
| znorm | Inf | ||
| sky | -Inf | -Inf | -Inf |
| S/N | 21.1 | 36.8 | 41.1 |
| S/N(c) | 0.0 | 0.0 | 0.0 |
| SN(E/C) |
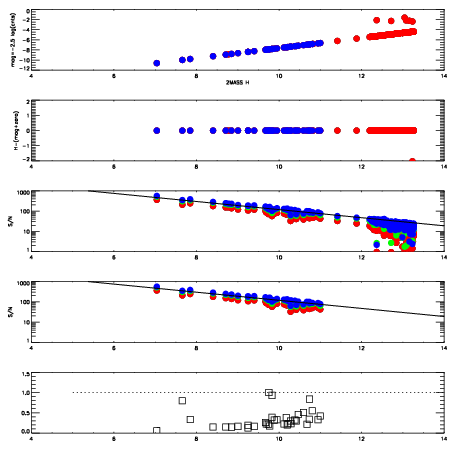
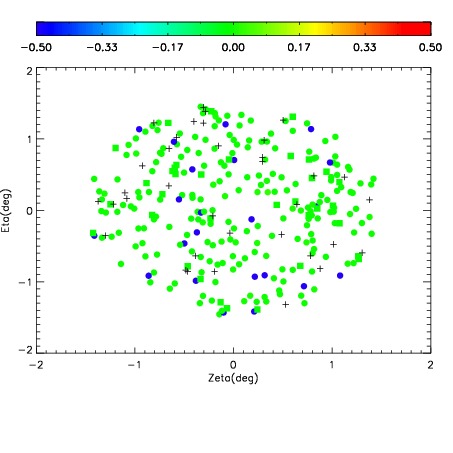
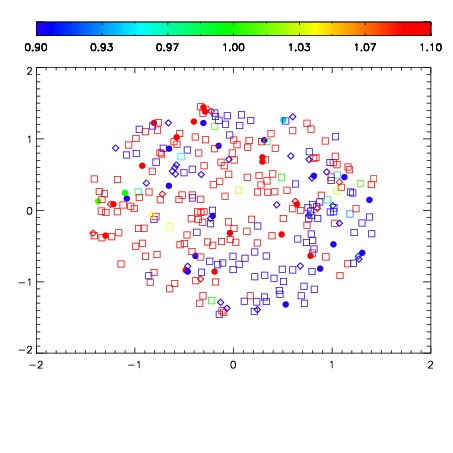


| Frame | Nreads | Zeropoints | Mag plots | Spatial mag deviation | Spatial sky 16325A emission deviations (filled: sky, open: star) | Spatial sky continuum emission | Spatial sky telluric CO2 absorption deviations (filled: H < 10) | |||||||||||||||||||||||
| 0 | 0 |
|
|
|
|
|
|
| IPAIR | NAME | SHIFT | NEWSHIFT | S/N | NAME | SHIFT | NEWSHIFT | S/N |
| 0 | 12030039 | 0.502146 | 0.00000 | 159.800 | 12030040 | 0.000445436 | 0.501701 | 159.822 |
| 1 | 12030038 | 0.501848 | 0.000298023 | 163.608 | 12030037 | 0.00000 | 0.502146 | 166.543 |
| 2 | 12030043 | 0.501003 | 0.00114298 | 139.995 | 12030041 | 0.000235733 | 0.501910 | 157.217 |
| 3 | 12030042 | 0.500911 | 0.00123501 | 133.829 | 12030044 | -0.000529902 | 0.502676 | 149.102 |