| Red | Green | Blue | |
| z | 17.64 | ||
| znorm | Inf | ||
| sky | -Inf | -Inf | -Inf |
| S/N | 8.6 | 19.0 | 20.6 |
| S/N(c) | 0.0 | 0.0 | 0.0 |
| SN(E/C) |
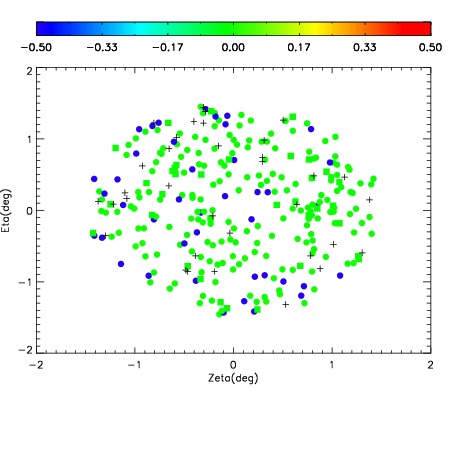
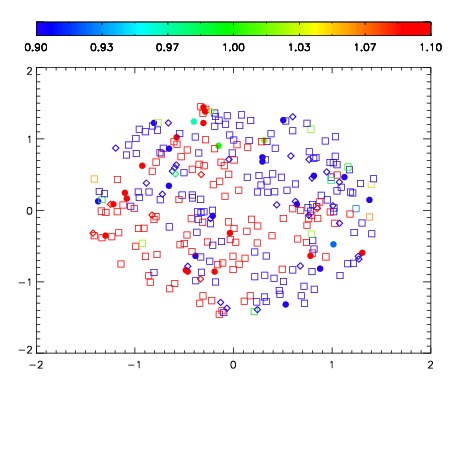
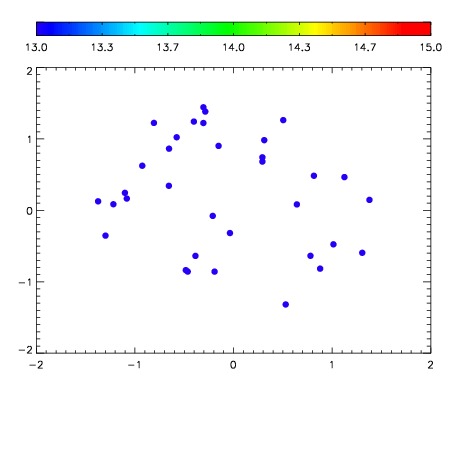

| Frame | Nreads | Zeropoints | Mag plots | Spatial mag deviation | Spatial sky 16325A emission deviations (filled: sky, open: star) | Spatial sky continuum emission | Spatial sky telluric CO2 absorption deviations (filled: H < 10) | |||||||||||||||||||||||
| 0 | 0 |
|
|
|
|
|
|
| IPAIR | NAME | SHIFT | NEWSHIFT | S/N | NAME | SHIFT | NEWSHIFT | S/N |
| 0 | 12260023 | 0.492198 | 0.00000 | 102.646 | 12260022 | 0.00000 | 0.492198 | 100.484 |
| 1 | 12260028 | 0.491351 | 0.000846982 | 108.411 | 12260029 | 0.000286533 | 0.491911 | 108.515 |
| 2 | 12260027 | 0.491022 | 0.00117600 | 106.514 | 12260026 | -0.00285110 | 0.495049 | 106.701 |
| 3 | 12260024 | 0.492094 | 0.000103980 | 103.055 | 12260025 | -0.00313699 | 0.495335 | 104.455 |