| Red | Green | Blue | |
| z | 17.64 | ||
| znorm | Inf | ||
| sky | -Inf | -Inf | -Inf |
| S/N | 30.9 | 49.5 | 57.7 |
| S/N(c) | 0.0 | 0.0 | 0.0 |
| SN(E/C) |
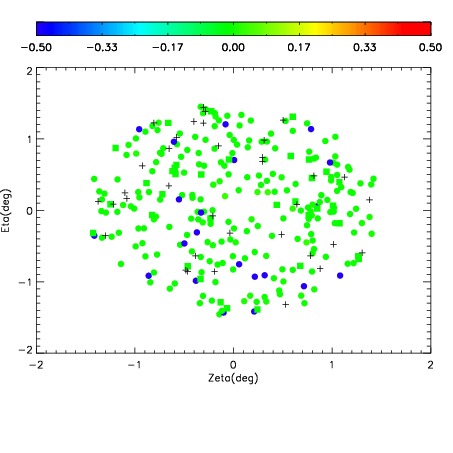
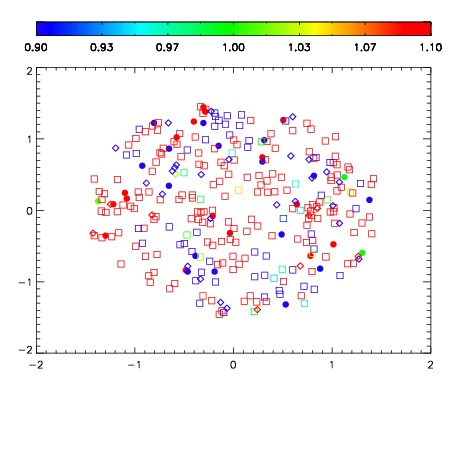
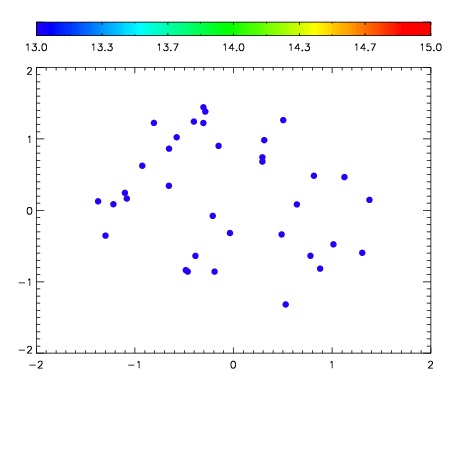

| Frame | Nreads | Zeropoints | Mag plots | Spatial mag deviation | Spatial sky 16325A emission deviations (filled: sky, open: star) | Spatial sky continuum emission | Spatial sky telluric CO2 absorption deviations (filled: H < 10) | |||||||||||||||||||||||
| 0 | 0 |
|
|
|
|
|
|
| IPAIR | NAME | SHIFT | NEWSHIFT | S/N | NAME | SHIFT | NEWSHIFT | S/N |
| 0 | 12310028 | 0.495431 | 0.00000 | 195.894 | 12310026 | -0.00156916 | 0.497000 | 196.013 |
| 1 | 12310023 | 0.494630 | 0.000800997 | 205.384 | 12310022 | 0.00000 | 0.495431 | 203.854 |
| 2 | 12310024 | 0.494786 | 0.000645012 | 204.857 | 12310025 | -0.00188097 | 0.497312 | 203.408 |
| 3 | 12310027 | 0.494824 | 0.000607014 | 195.886 | 12310029 | -0.00218256 | 0.497614 | 195.345 |