| Red | Green | Blue | |
| z | 17.64 | ||
| znorm | Inf | ||
| sky | -Inf | -Inf | -Inf |
| S/N | 6.7 | 16.2 | 15.4 |
| S/N(c) | 0.0 | 0.0 | 0.0 |
| SN(E/C) |
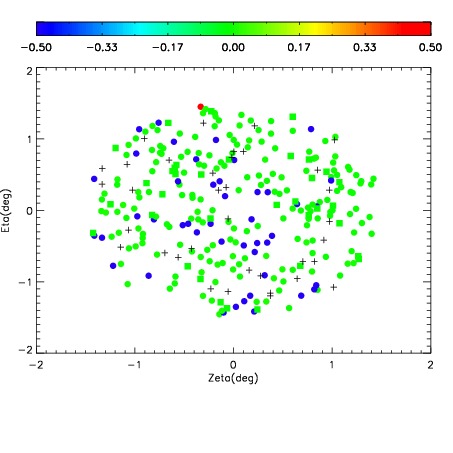
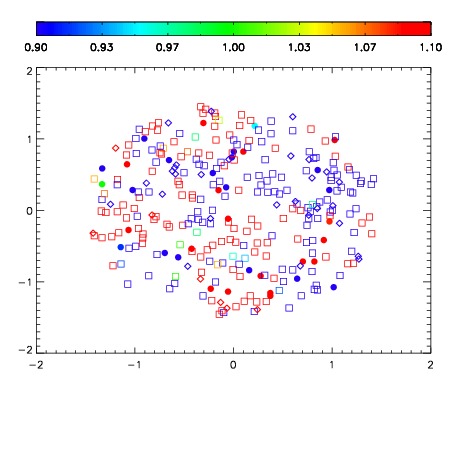
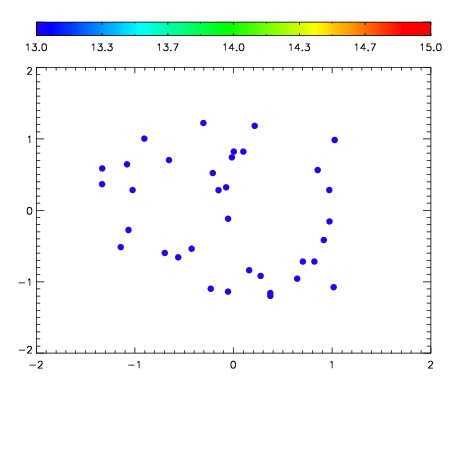

| Frame | Nreads | Zeropoints | Mag plots | Spatial mag deviation | Spatial sky 16325A emission deviations (filled: sky, open: star) | Spatial sky continuum emission | Spatial sky telluric CO2 absorption deviations (filled: H < 10) | |||||||||||||||||||||||
| 0 | 0 |
|
|
|
|
|
|
| IPAIR | NAME | SHIFT | NEWSHIFT | S/N | NAME | SHIFT | NEWSHIFT | S/N |
| 0 | 12260016 | 0.492889 | 0.00000 | 100.097 | 12260015 | 0.000773792 | 0.492115 | 102.519 |
| 1 | 12260013 | 0.492721 | 0.000167996 | 103.425 | 12260011 | 0.00000 | 0.492889 | 106.517 |
| 2 | 12260017 | 0.492724 | 0.000164986 | 100.752 | 12260014 | 0.000248622 | 0.492640 | 106.305 |
| 3 | 12260012 | 0.492128 | 0.000760972 | 100.023 | 12260018 | 0.00207523 | 0.490814 | 96.5937 |