| Red | Green | Blue | |
| z | 17.64 | ||
| znorm | Inf | ||
| sky | -Inf | -Inf | -Inf |
| S/N | 30.7 | 52.2 | 55.6 |
| S/N(c) | 0.0 | 0.0 | 0.0 |
| SN(E/C) |
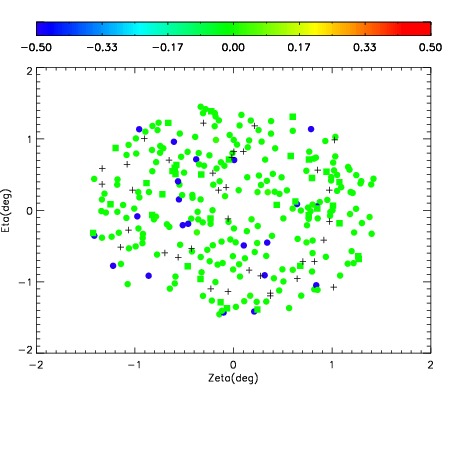
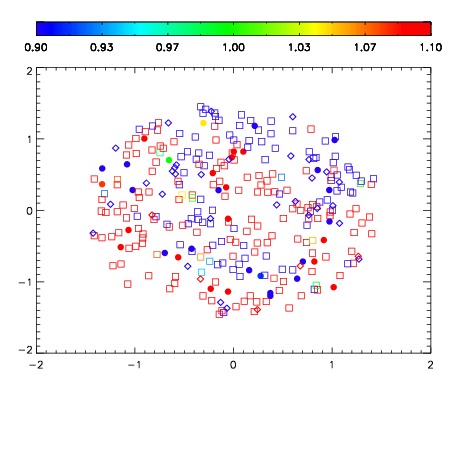
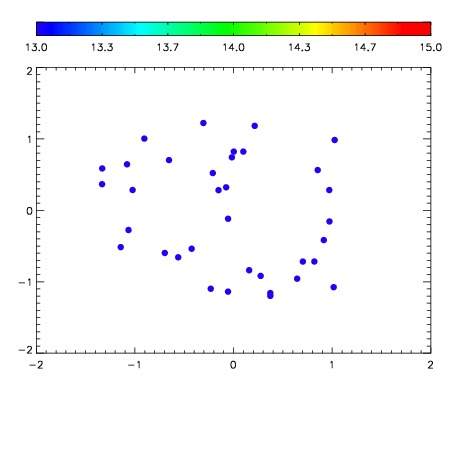

| Frame | Nreads | Zeropoints | Mag plots | Spatial mag deviation | Spatial sky 16325A emission deviations (filled: sky, open: star) | Spatial sky continuum emission | Spatial sky telluric CO2 absorption deviations (filled: H < 10) | |||||||||||||||||||||||
| 0 | 0 |
|
|
|
|
|
|
| IPAIR | NAME | SHIFT | NEWSHIFT | S/N | NAME | SHIFT | NEWSHIFT | S/N |
| 0 | 12310012 | 0.487544 | 0.00000 | 198.981 | 12310011 | 0.00000 | 0.487544 | 190.139 |
| 1 | 12310017 | 0.486857 | 0.000687003 | 206.309 | 12310018 | -0.00829851 | 0.495843 | 208.826 |
| 2 | 12310016 | 0.486364 | 0.00117999 | 203.838 | 12310015 | -0.00224086 | 0.489785 | 203.503 |
| 3 | 12310013 | 0.487355 | 0.000189006 | 200.458 | 12310014 | -0.00264075 | 0.490185 | 201.917 |