| Red | Green | Blue | |
| z | 17.64 | ||
| znorm | Inf | ||
| sky | -Inf | -Inf | -Inf |
| S/N | 29.6 | 50.1 | 53.4 |
| S/N(c) | 0.0 | 0.0 | 0.0 |
| SN(E/C) |
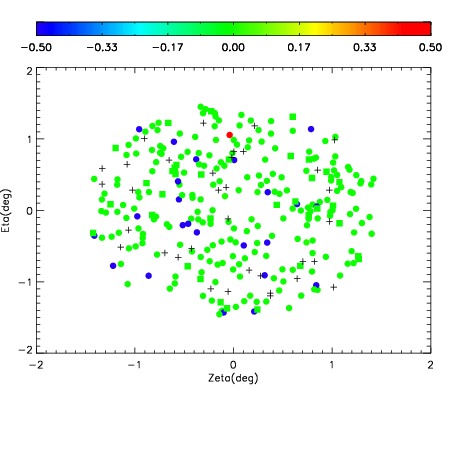
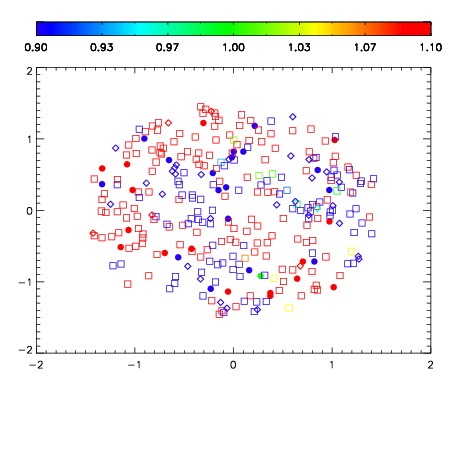
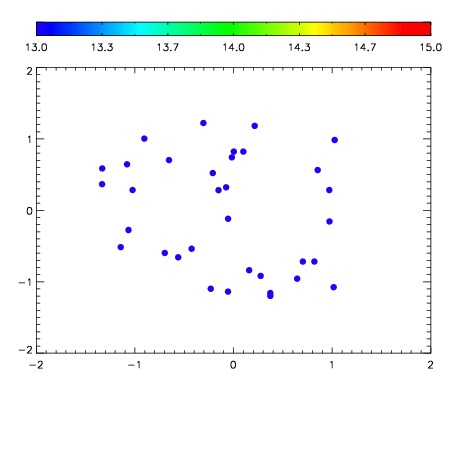

| Frame | Nreads | Zeropoints | Mag plots | Spatial mag deviation | Spatial sky 16325A emission deviations (filled: sky, open: star) | Spatial sky continuum emission | Spatial sky telluric CO2 absorption deviations (filled: H < 10) | |||||||||||||||||||||||
| 0 | 0 |
|
|
|
|
|
|
| IPAIR | NAME | SHIFT | NEWSHIFT | S/N | NAME | SHIFT | NEWSHIFT | S/N |
| 0 | 12550017 | 0.485373 | 0.00000 | 187.386 | 12550018 | -0.00432045 | 0.489693 | 186.413 |
| 1 | 12550016 | 0.484633 | 0.000739992 | 183.898 | 12550011 | 0.00000 | 0.485373 | 181.603 |
| 2 | 12550013 | 0.484392 | 0.000981003 | 178.268 | 12550015 | -0.00329182 | 0.488665 | 181.545 |
| 3 | 12550012 | 0.484044 | 0.00132900 | 176.277 | 12550014 | -0.00349400 | 0.488867 | 176.663 |