| Red | Green | Blue | |
| z | 17.65 | ||
| znorm | Inf | ||
| sky | -Inf | -Inf | -Inf |
| S/N | 11.5 | 23.1 | 23.2 |
| S/N(c) | 0.0 | 0.0 | 0.0 |
| SN(E/C) |
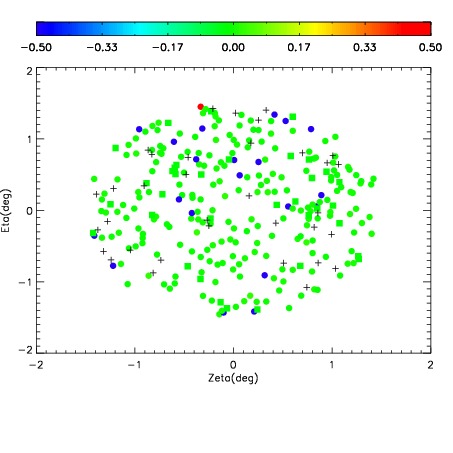
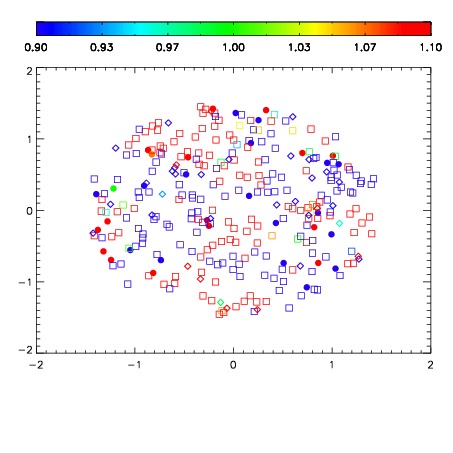
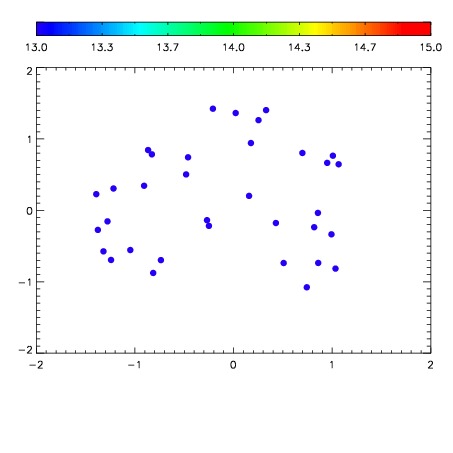

| Frame | Nreads | Zeropoints | Mag plots | Spatial mag deviation | Spatial sky 16325A emission deviations (filled: sky, open: star) | Spatial sky continuum emission | Spatial sky telluric CO2 absorption deviations (filled: H < 10) | |||||||||||||||||||||||
| 0 | 0 |
|
|
|
|
|
|
| IPAIR | NAME | SHIFT | NEWSHIFT | S/N | NAME | SHIFT | NEWSHIFT | S/N |
| 0 | 12290013 | 0.497157 | 0.00000 | 136.408 | 12290011 | 0.00000 | 0.497157 | 128.745 |
| 1 | 12290017 | 0.496318 | 0.000838995 | 117.810 | 12290015 | -0.00155966 | 0.498717 | 126.250 |
| 2 | 12290016 | 0.496588 | 0.000569016 | 113.109 | 12290018 | -0.000685775 | 0.497843 | 125.376 |
| 3 | 12290012 | 0.496605 | 0.000551999 | 106.664 | 12290014 | -0.00138043 | 0.498537 | 115.652 |