| Red | Green | Blue | |
| z | 17.64 | ||
| znorm | Inf | ||
| sky | -Inf | -Inf | -Inf |
| S/N | 25.9 | 44.2 | 47.0 |
| S/N(c) | 0.0 | 0.0 | 0.0 |
| SN(E/C) |

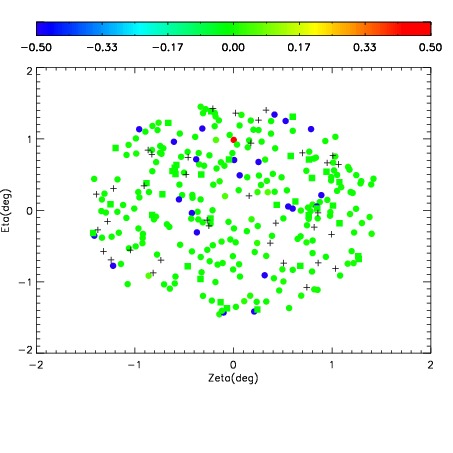
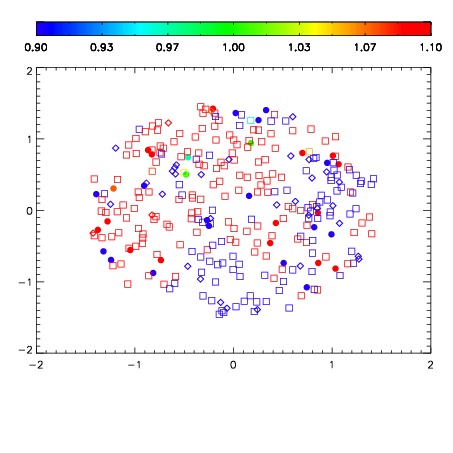


| Frame | Nreads | Zeropoints | Mag plots | Spatial mag deviation | Spatial sky 16325A emission deviations (filled: sky, open: star) | Spatial sky continuum emission | Spatial sky telluric CO2 absorption deviations (filled: H < 10) | |||||||||||||||||||||||
| 0 | 0 |
|
|
|
|
|
|
| IPAIR | NAME | SHIFT | NEWSHIFT | S/N | NAME | SHIFT | NEWSHIFT | S/N |
| 0 | 12540017 | 0.491739 | 0.00000 | 198.031 | 12540018 | 0.000790837 | 0.490948 | 199.780 |
| 1 | 12540013 | 0.490244 | 0.00149500 | 198.021 | 12540014 | -0.000138250 | 0.491877 | 195.597 |
| 2 | 12540012 | 0.490648 | 0.00109100 | 194.144 | 12540015 | 0.000310131 | 0.491429 | 194.559 |
| 3 | 12540016 | 0.491101 | 0.000638008 | 193.944 | 12540011 | 0.00000 | 0.491739 | 191.687 |