| Red | Green | Blue | |
| z | 17.64 | ||
| znorm | Inf | ||
| sky | -NaN | -Inf | -Inf |
| S/N | 25.8 | 45.3 | 49.7 |
| S/N(c) | 0.0 | 0.0 | 0.0 |
| SN(E/C) |
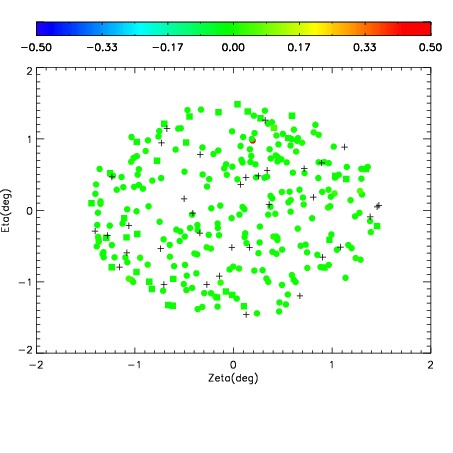
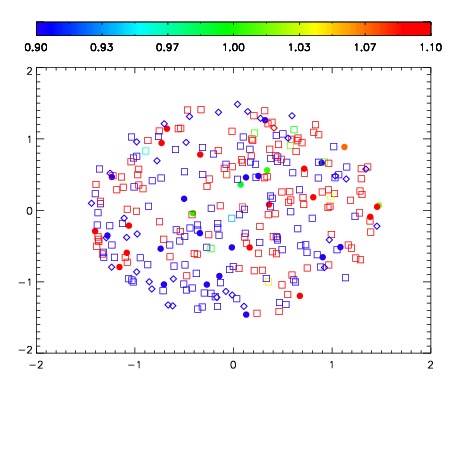
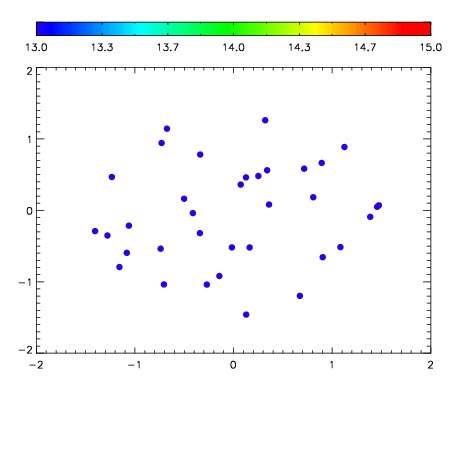

| Frame | Nreads | Zeropoints | Mag plots | Spatial mag deviation | Spatial sky 16325A emission deviations (filled: sky, open: star) | Spatial sky continuum emission | Spatial sky telluric CO2 absorption deviations (filled: H < 10) | |||||||||||||||||||||||
| 0 | 0 |
|
|
|
|
|
|
| IPAIR | NAME | SHIFT | NEWSHIFT | S/N | NAME | SHIFT | NEWSHIFT | S/N |
| 0 | 11940032 | 0.500360 | 0.00000 | 241.032 | 11940029 | -0.00181477 | 0.502175 | 238.843 |
| 1 | 11940028 | 0.499940 | 0.000420004 | 240.562 | 11940033 | -0.00102798 | 0.501388 | 238.766 |
| 2 | 11940027 | 0.499598 | 0.000762016 | 237.378 | 11940030 | -0.00175936 | 0.502119 | 238.641 |
| 3 | 11940031 | 0.500130 | 0.000230014 | 234.964 | 11940026 | 0.00000 | 0.500360 | 237.831 |