| Red | Green | Blue | |
| z | 17.63 | ||
| znorm | Inf | ||
| sky | -Inf | -NaN | -Inf |
| S/N | 21.2 | 38.6 | 40.9 |
| S/N(c) | 0.0 | 0.0 | 0.0 |
| SN(E/C) |
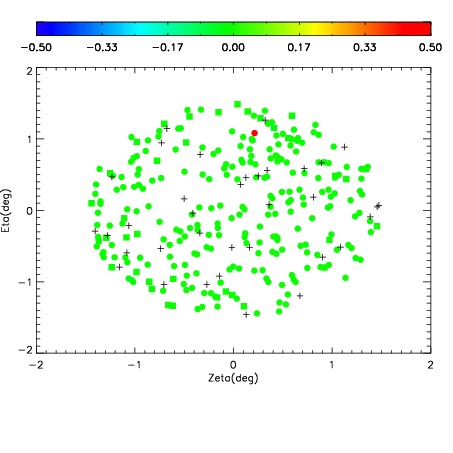

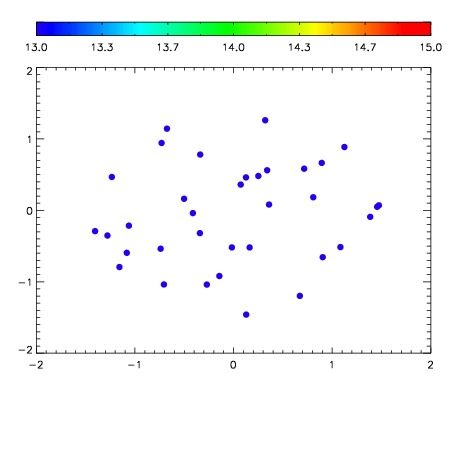

| Frame | Nreads | Zeropoints | Mag plots | Spatial mag deviation | Spatial sky 16325A emission deviations (filled: sky, open: star) | Spatial sky continuum emission | Spatial sky telluric CO2 absorption deviations (filled: H < 10) | |||||||||||||||||||||||
| 0 | 0 |
|
|
|
|
|
|
| IPAIR | NAME | SHIFT | NEWSHIFT | S/N | NAME | SHIFT | NEWSHIFT | S/N |
| 0 | 11990013 | 0.505072 | 0.00000 | 231.148 | 11990015 | -0.00236415 | 0.507436 | 232.177 |
| 1 | 11990017 | 0.503082 | 0.00199002 | 233.477 | 11990018 | -0.00114598 | 0.506218 | 238.180 |
| 2 | 11990016 | 0.502918 | 0.00215399 | 232.907 | 11990014 | -0.00225835 | 0.507330 | 235.671 |
| 3 | 11990012 | 0.504867 | 0.000204980 | 230.212 | 11990011 | 0.00000 | 0.505072 | 225.899 |