| Red | Green | Blue | |
| z | 17.64 | ||
| znorm | Inf | ||
| sky | -NaN | -NaN | -Inf |
| S/N | 26.1 | 47.5 | 52.2 |
| S/N(c) | 0.0 | 0.0 | 0.0 |
| SN(E/C) |


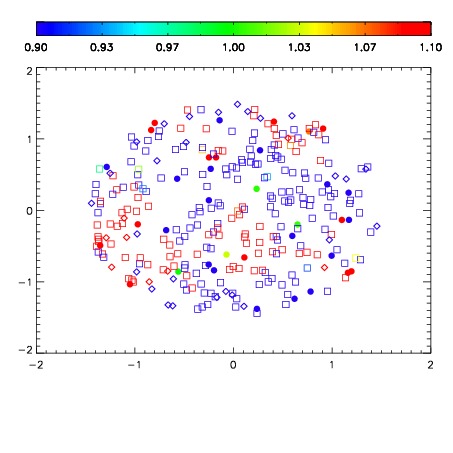


| Frame | Nreads | Zeropoints | Mag plots | Spatial mag deviation | Spatial sky 16325A emission deviations (filled: sky, open: star) | Spatial sky continuum emission | Spatial sky telluric CO2 absorption deviations (filled: H < 10) | |||||||||||||||||||||||
| 0 | 0 |
|
|
|
|
|
|
| IPAIR | NAME | SHIFT | NEWSHIFT | S/N | NAME | SHIFT | NEWSHIFT | S/N |
| 0 | 12530017 | 0.499707 | 0.00000 | 230.054 | 12530018 | -0.00128378 | 0.500991 | 238.957 |
| 1 | 12530012 | 0.495322 | 0.00438502 | 246.328 | 12530014 | -0.000158414 | 0.499865 | 245.044 |
| 2 | 12530013 | 0.495361 | 0.00434601 | 246.176 | 12530011 | 0.00000 | 0.499707 | 243.536 |
| 3 | 12530016 | 0.499666 | 4.10080e-05 | 234.859 | 12530015 | -0.000128570 | 0.499836 | 239.084 |