| Red | Green | Blue | |
| z | 17.64 | ||
| znorm | Inf | ||
| sky | -Inf | -Inf | -Inf |
| S/N | 18.9 | 33.5 | 36.6 |
| S/N(c) | 0.0 | 0.0 | 0.0 |
| SN(E/C) |

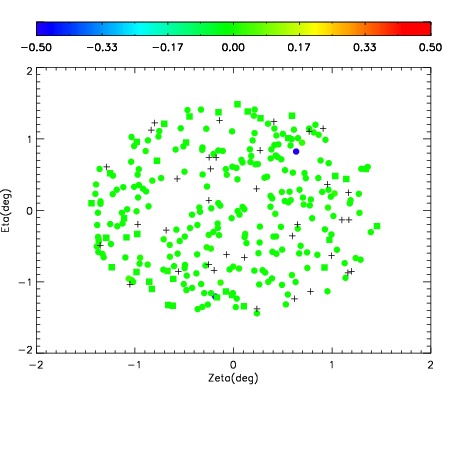
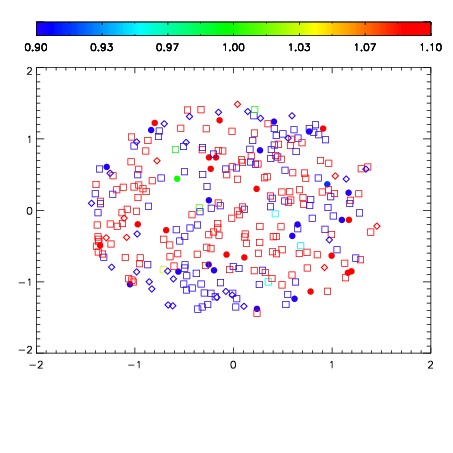


| Frame | Nreads | Zeropoints | Mag plots | Spatial mag deviation | Spatial sky 16325A emission deviations (filled: sky, open: star) | Spatial sky continuum emission | Spatial sky telluric CO2 absorption deviations (filled: H < 10) | |||||||||||||||||||||||
| 0 | 0 |
|
|
|
|
|
|
| IPAIR | NAME | SHIFT | NEWSHIFT | S/N | NAME | SHIFT | NEWSHIFT | S/N |
| 0 | 12570017 | 0.487165 | 0.00000 | 210.736 | 12570018 | 0.00260796 | 0.484557 | 213.472 |
| 1 | 12570012 | 0.485044 | 0.00212100 | 230.784 | 12570011 | 0.00000 | 0.487165 | 235.731 |
| 2 | 12570016 | 0.487153 | 1.20103e-05 | 204.789 | 12570014 | 0.000824961 | 0.486340 | 188.349 |
| 3 | 12570013 | 0.485112 | 0.00205299 | 188.126 | 12570015 | 0.00121045 | 0.485955 | 150.626 |