| Red | Green | Blue | |
| z | 17.64 | ||
| znorm | Inf | ||
| sky | -Inf | -Inf | -Inf |
| S/N | 26.4 | 46.5 | 48.4 |
| S/N(c) | 0.0 | 0.0 | 0.0 |
| SN(E/C) |

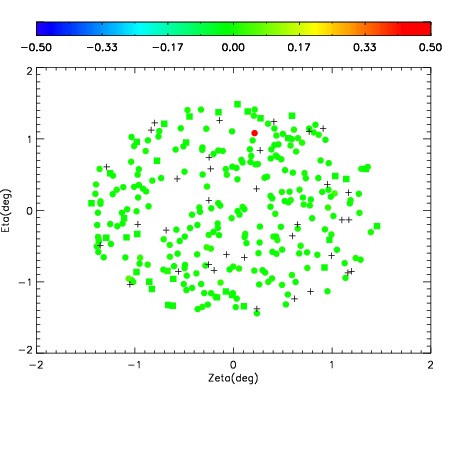
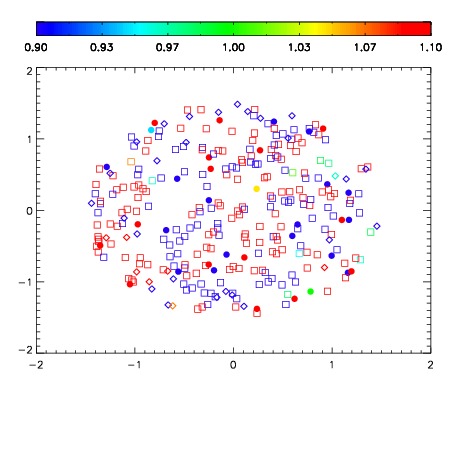


| Frame | Nreads | Zeropoints | Mag plots | Spatial mag deviation | Spatial sky 16325A emission deviations (filled: sky, open: star) | Spatial sky continuum emission | Spatial sky telluric CO2 absorption deviations (filled: H < 10) | |||||||||||||||||||||||
| 0 | 0 |
|
|
|
|
|
|
| IPAIR | NAME | SHIFT | NEWSHIFT | S/N | NAME | SHIFT | NEWSHIFT | S/N |
| 0 | 12620017 | 0.487513 | 0.00000 | 220.634 | 12620018 | 0.000747601 | 0.486765 | 198.621 |
| 1 | 12620012 | 0.486201 | 0.00131202 | 237.191 | 12620011 | 0.00000 | 0.487513 | 235.715 |
| 2 | 12620013 | 0.486307 | 0.00120601 | 236.233 | 12620014 | 0.000453571 | 0.487059 | 235.293 |
| 3 | 12620016 | 0.487380 | 0.000133008 | 223.863 | 12620015 | 0.000981421 | 0.486532 | 233.386 |