| Red | Green | Blue | |
| z | 17.64 | ||
| znorm | Inf | ||
| sky | -Inf | -Inf | -Inf |
| S/N | 19.9 | 36.8 | 41.0 |
| S/N(c) | 0.0 | 0.0 | 0.0 |
| SN(E/C) |
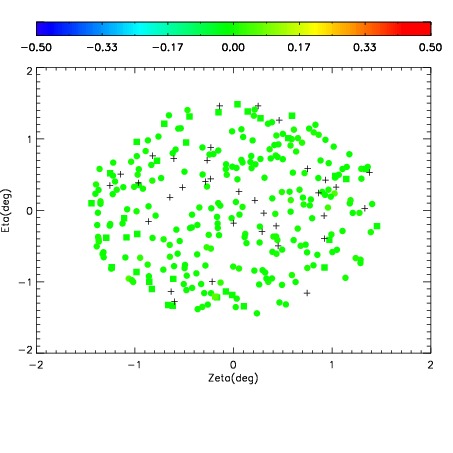

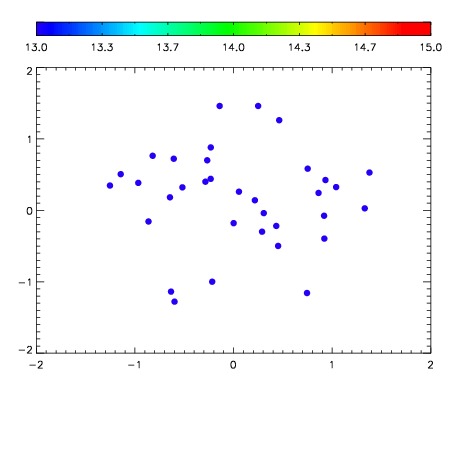

| Frame | Nreads | Zeropoints | Mag plots | Spatial mag deviation | Spatial sky 16325A emission deviations (filled: sky, open: star) | Spatial sky continuum emission | Spatial sky telluric CO2 absorption deviations (filled: H < 10) | |||||||||||||||||||||||
| 0 | 0 |
|
|
|
|
|
|
| IPAIR | NAME | SHIFT | NEWSHIFT | S/N | NAME | SHIFT | NEWSHIFT | S/N |
| 0 | 12280017 | 0.497691 | 0.00000 | 224.512 | 12280014 | -0.00137568 | 0.499067 | 228.900 |
| 1 | 12280013 | 0.497494 | 0.000196993 | 222.999 | 12280015 | -0.000897356 | 0.498588 | 223.871 |
| 2 | 12280012 | 0.497117 | 0.000573993 | 222.732 | 12280018 | -0.00120398 | 0.498895 | 219.952 |
| 3 | 12280016 | 0.497453 | 0.000238001 | 213.380 | 12280011 | 0.00000 | 0.497691 | 213.746 |