| Red | Green | Blue | |
| z | 17.64 | ||
| znorm | Inf | ||
| sky | -Inf | -Inf | -Inf |
| S/N | 28.3 | 49.6 | 54.7 |
| S/N(c) | 0.0 | 0.0 | 0.0 |
| SN(E/C) |
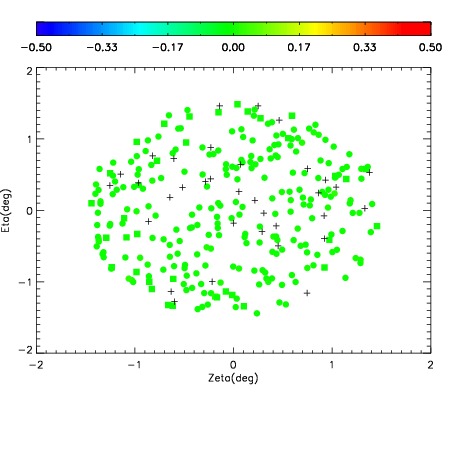
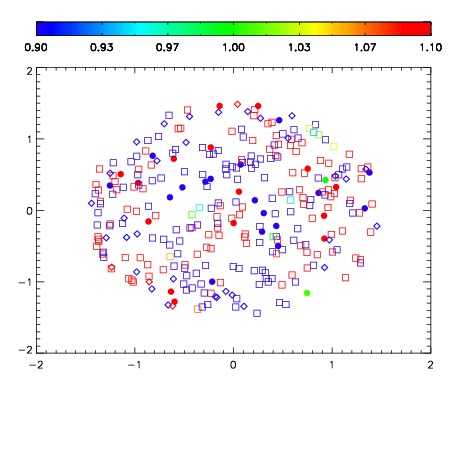
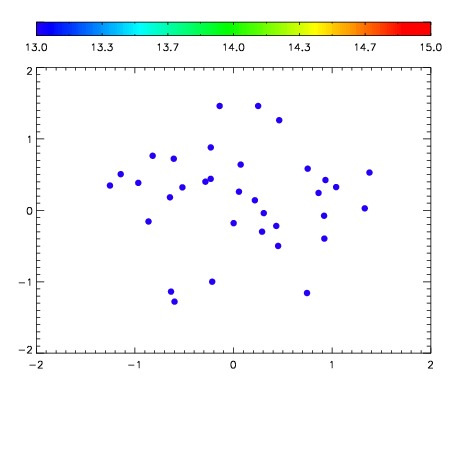

| Frame | Nreads | Zeropoints | Mag plots | Spatial mag deviation | Spatial sky 16325A emission deviations (filled: sky, open: star) | Spatial sky continuum emission | Spatial sky telluric CO2 absorption deviations (filled: H < 10) | |||||||||||||||||||||||
| 0 | 0 |
|
|
|
|
|
|
| IPAIR | NAME | SHIFT | NEWSHIFT | S/N | NAME | SHIFT | NEWSHIFT | S/N |
| 0 | 12520017 | 0.491268 | 0.00000 | 252.193 | 12520018 | 0.00232500 | 0.488943 | 254.982 |
| 1 | 12520013 | 0.490852 | 0.000416011 | 259.676 | 12520015 | 0.00110559 | 0.490162 | 259.617 |
| 2 | 12520012 | 0.490794 | 0.000474006 | 258.103 | 12520014 | 0.000942436 | 0.490326 | 256.820 |
| 3 | 12520016 | 0.490789 | 0.000479013 | 253.851 | 12520011 | 0.00000 | 0.491268 | 255.996 |