| Red | Green | Blue | |
| z | 17.64 | ||
| znorm | Inf | ||
| sky | -Inf | -Inf | -Inf |
| S/N | 28.2 | 49.8 | 54.1 |
| S/N(c) | 0.0 | 0.0 | 0.0 |
| SN(E/C) |
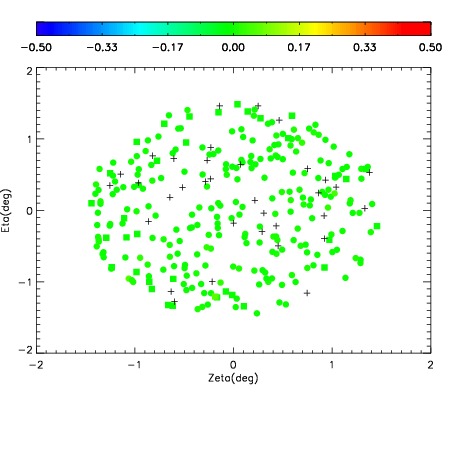
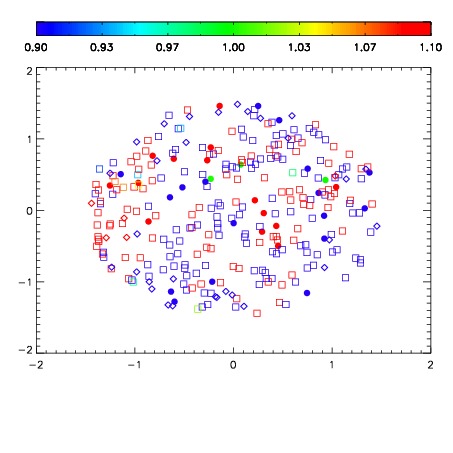
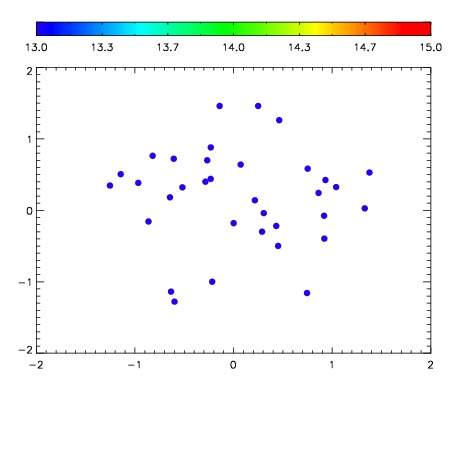

| Frame | Nreads | Zeropoints | Mag plots | Spatial mag deviation | Spatial sky 16325A emission deviations (filled: sky, open: star) | Spatial sky continuum emission | Spatial sky telluric CO2 absorption deviations (filled: H < 10) | |||||||||||||||||||||||
| 0 | 0 |
|
|
|
|
|
|
| IPAIR | NAME | SHIFT | NEWSHIFT | S/N | NAME | SHIFT | NEWSHIFT | S/N |
| 0 | 12560013 | 0.493767 | 0.00000 | 263.050 | 12560018 | 0.00106142 | 0.492706 | 263.672 |
| 1 | 12560016 | 0.493640 | 0.000126988 | 264.605 | 12560011 | 0.00000 | 0.493767 | 264.758 |
| 2 | 12560017 | 0.493468 | 0.000299007 | 264.457 | 12560015 | -0.00101750 | 0.494785 | 264.227 |
| 3 | 12560012 | 0.493555 | 0.000211984 | 262.981 | 12560014 | -0.000942974 | 0.494710 | 263.668 |