| Red | Green | Blue | |
| z | 17.64 | ||
| znorm | Inf | ||
| sky | -NaN | -Inf | -Inf |
| S/N | 26.8 | 43.1 | 53.3 |
| S/N(c) | 0.0 | 0.0 | 0.0 |
| SN(E/C) |
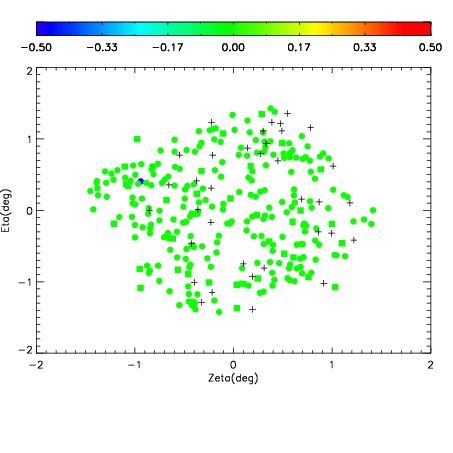
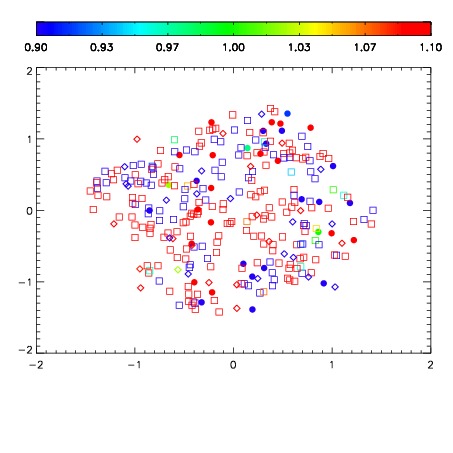
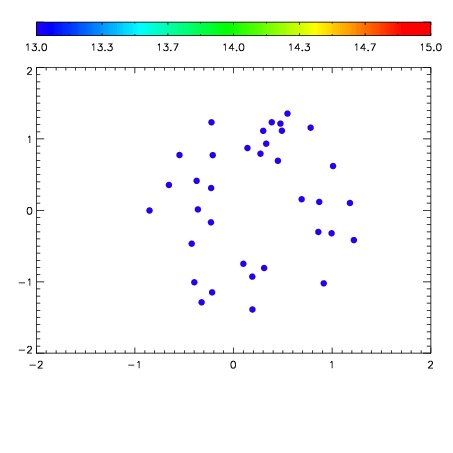

| Frame | Nreads | Zeropoints | Mag plots | Spatial mag deviation | Spatial sky 16325A emission deviations (filled: sky, open: star) | Spatial sky continuum emission | Spatial sky telluric CO2 absorption deviations (filled: H < 10) | |||||||||||||||||||||||
| 0 | 0 |
|
|
|
|
|
|
| IPAIR | NAME | SHIFT | NEWSHIFT | S/N | NAME | SHIFT | NEWSHIFT | S/N |
| 0 | 11950070 | 0.500194 | 0.00000 | 198.992 | 11950069 | 0.00000 | 0.500194 | 194.767 |
| 1 | 11950074 | 0.499583 | 0.000611007 | 209.854 | 11950076 | -0.00326437 | 0.503458 | 208.084 |
| 2 | 11950075 | 0.500022 | 0.000172019 | 209.431 | 11950073 | -0.00292186 | 0.503116 | 207.208 |
| 3 | 11950071 | 0.499721 | 0.000473022 | 200.838 | 11950072 | -0.00306978 | 0.503264 | 205.094 |