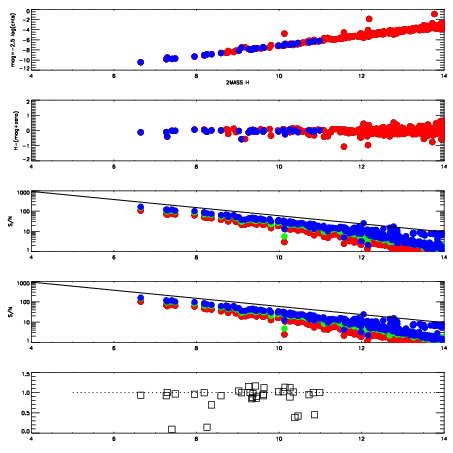
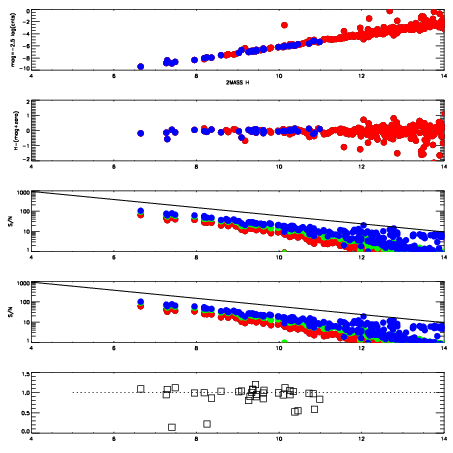
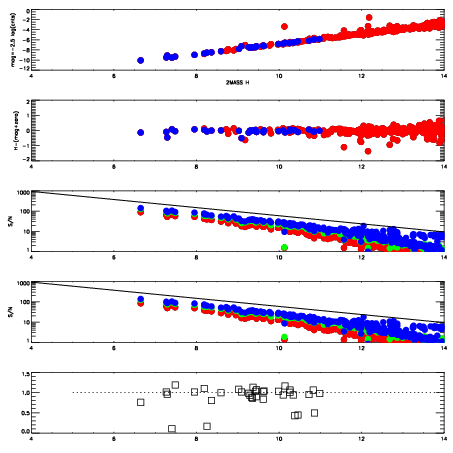
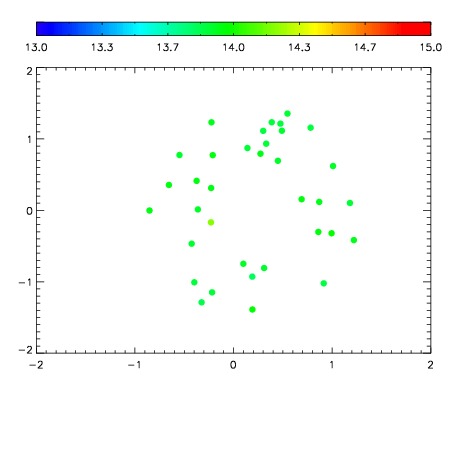
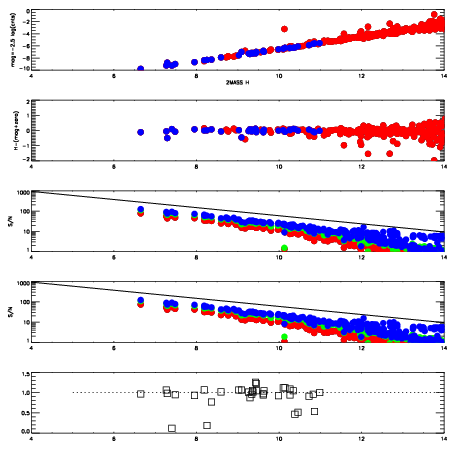
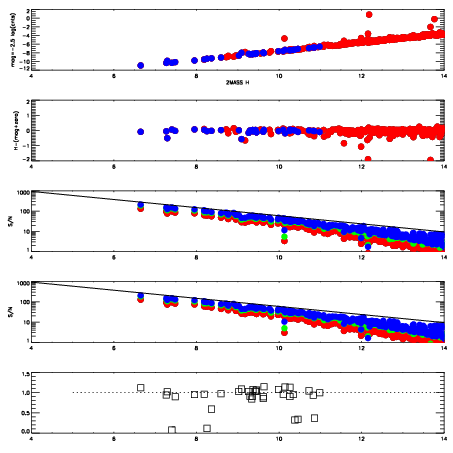
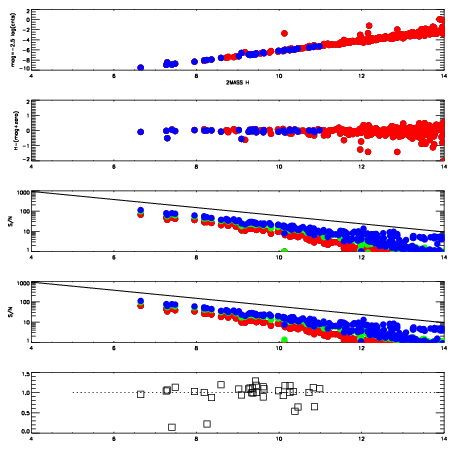
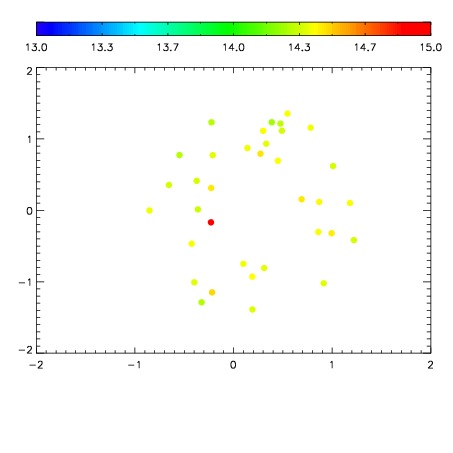
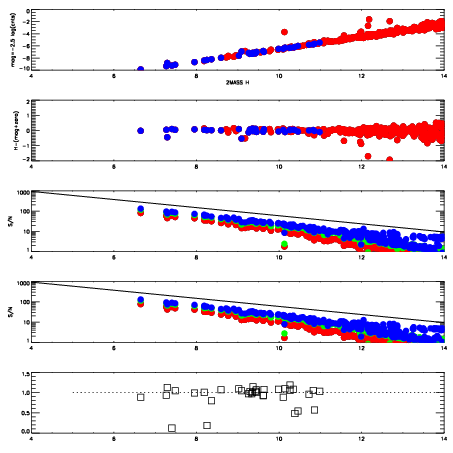
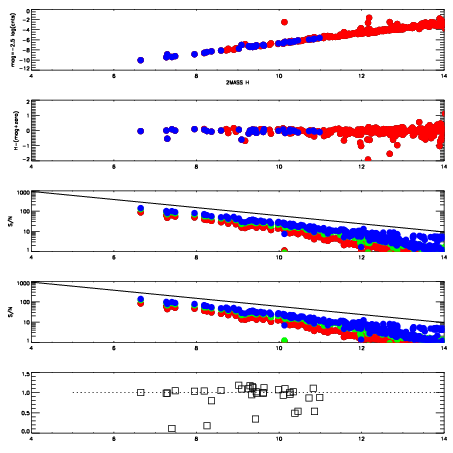
| Frame | Nreads | Zeropoints | Mag plots
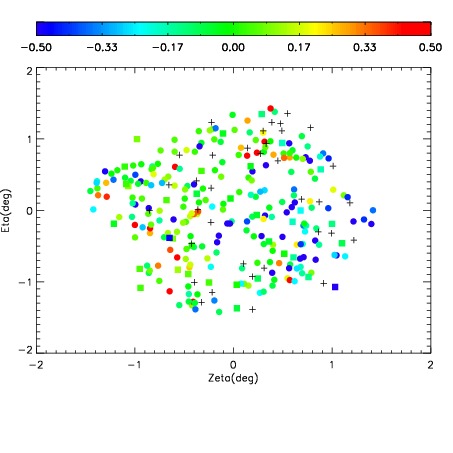
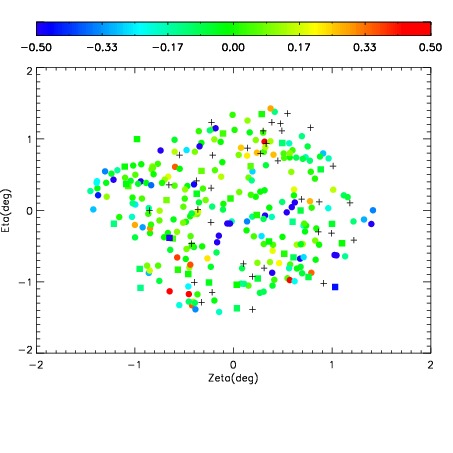
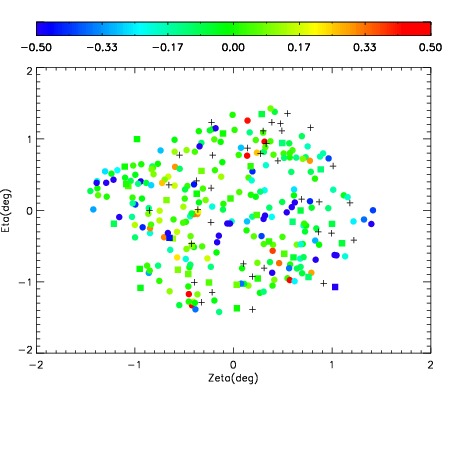
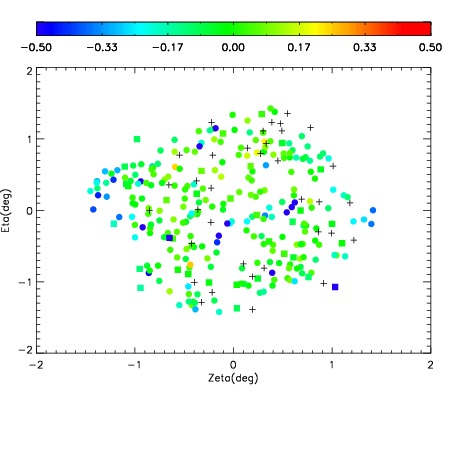
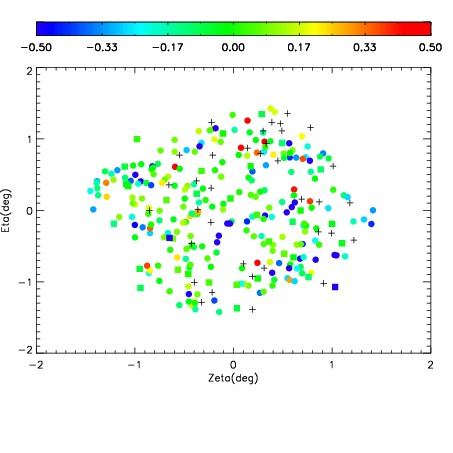
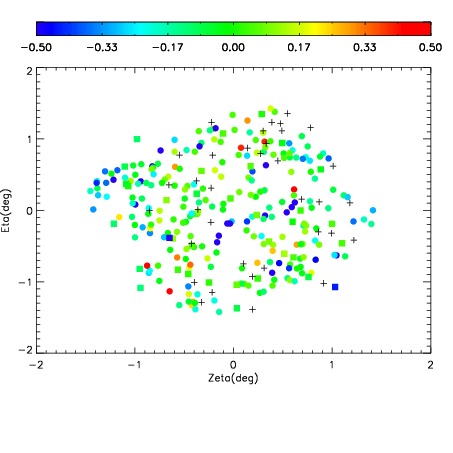
| Spatial mag deviation
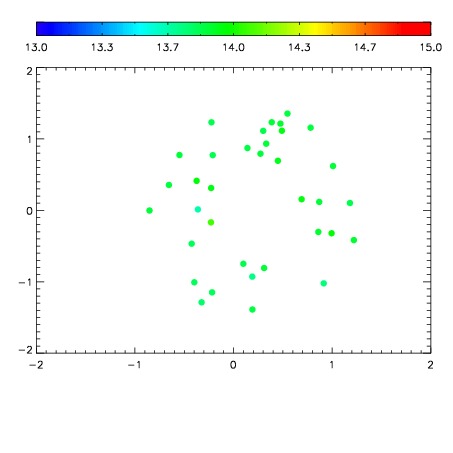
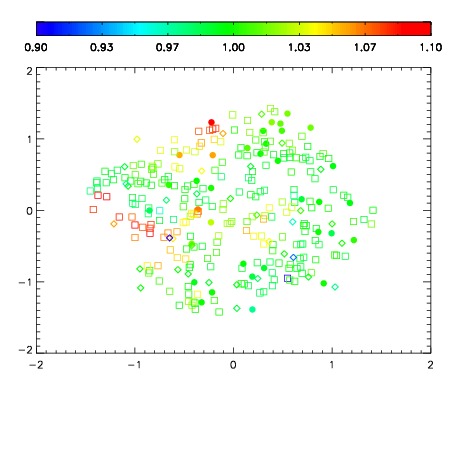
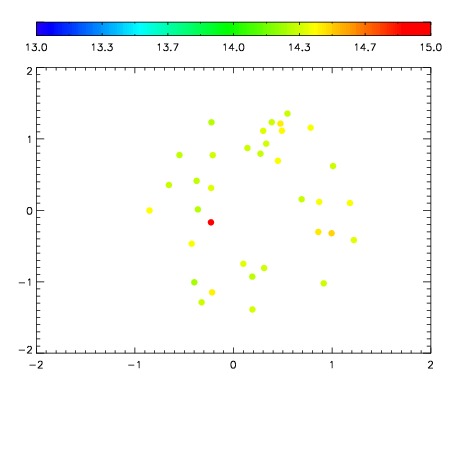
| Spatial sky 16325A emission deviations (filled: sky, open: star)
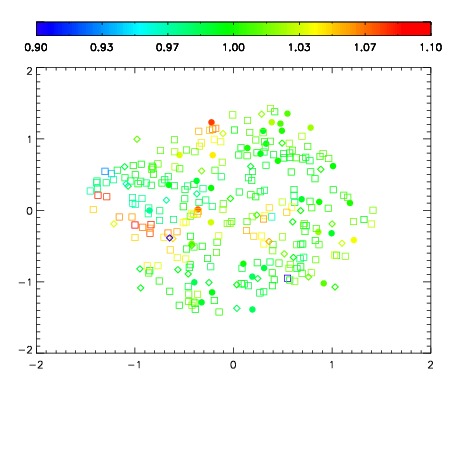
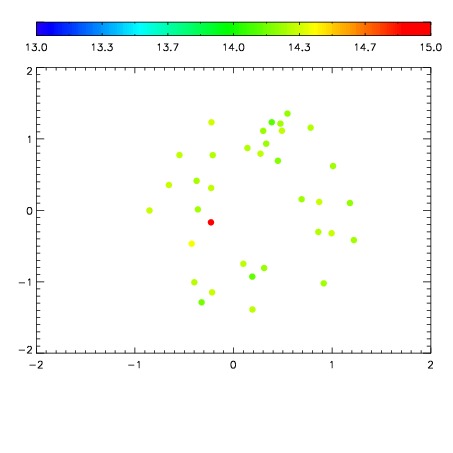
| Spatial sky continuum emission
| Spatial sky telluric CO2 absorption deviations (filled: H < 10)
|
| 11960041
| 47
| | Red | Green | Blue
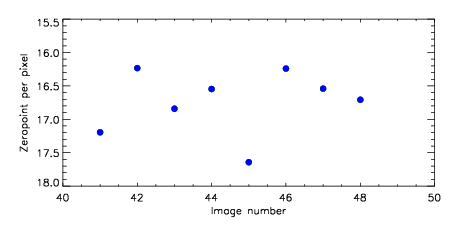
| | z | | 17.19
| | znorm | | 13.01
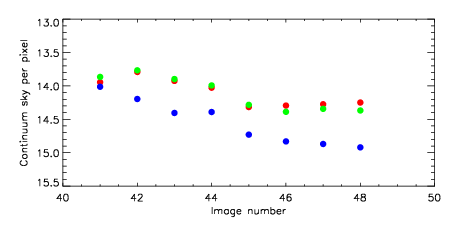
| | sky | 13.9 | 13.9 | 14.0
| | S/N | 3.0 | 6.2 | 7.9
| | S/N(c) | 2.6 | 5.5 | 7.4
| | SN(E/C) 0.96
|
| 
| 
| 
| 
| 
|
| 11960042
| 47
| | Red | Green | Blue
| | z | | 16.23
| | znorm | | 12.05
| | sky | 13.8 | 13.8 | 14.2
| | S/N | 1.4 | 2.8 | 3.4
| | S/N(c) | 1.1 | 2.7 | 3.0
| | SN(E/C) 0.99
|
| 
| 
| 
| 
| 
|
| 11960043
| 47
| | Red | Green | Blue
| | z | | 16.84
| | znorm | | 12.66
| | sky | 13.9 | 13.9 | 14.4
| | S/N | 2.3 | 4.7 | 6.1
| | S/N(c) | 2.1 | 4.5 | 5.4
| | SN(E/C) 0.98
|
| 
| 
| 
| 
| 
|
| 11960044
| 47
| | Red | Green | Blue
| | z | | 16.55
| | znorm | | 12.37
| | sky | 14.0 | 14.0 | 14.4
| | S/N | 1.7 | 3.8 | 4.9
| | S/N(c) | 1.5 | 3.7 | 4.4
| | SN(E/C) 0.98
|
| 
| 
| 
| 
| 
|
| 11960045
| 47
| | Red | Green | Blue
| | z | | 17.64
| | znorm | | 13.46
| | sky | 14.3 | 14.3 | 14.7
| | S/N | 5.0 | 9.1 | 11.3
| | S/N(c) | 4.3 | 8.3 | 10.2
| | SN(E/C) 0.96
|
| 
| 
| 
| 
| 
|
| 11960046
| 47
| | Red | Green | Blue
| | z | | 16.24
| | znorm | | 12.06
| | sky | 14.3 | 14.4 | 14.8
| | S/N | 1.3 | 2.9 | 3.7
| | S/N(c) | 1.1 | 3.0 | 3.4
| | SN(E/C) 1.03
|
| 
| 
| 
| 
| 
|
| 11960047
| 47
| | Red | Green | Blue
| | z | | 16.54
| | znorm | | 12.36
| | sky | 14.3 | 14.3 | 14.9
| | S/N | 1.9 | 4.1 | 5.0
| | S/N(c) | 1.7 | 4.1 | 4.5
| | SN(E/C) 1.01
|
| 
| 
| 
| 
| 
|
| 11960048
| 47
| | Red | Green | Blue
| | z | | 16.71
| | znorm | | 12.53
| | sky | 14.2 | 14.4 | 14.9
| | S/N | 1.8 | 4.7 | 5.9
| | S/N(c) | 1.6 | 4.4 | 5.2
| | SN(E/C) 1.00
|
| 
| 
| 
| 
| 
|