| Red | Green | Blue | |
| z | 17.65 | ||
| znorm | Inf | ||
| sky | -Inf | -Inf | -Inf |
| S/N | 4.2 | 8.9 | 10.2 |
| S/N(c) | 0.0 | 0.0 | 0.0 |
| SN(E/C) |
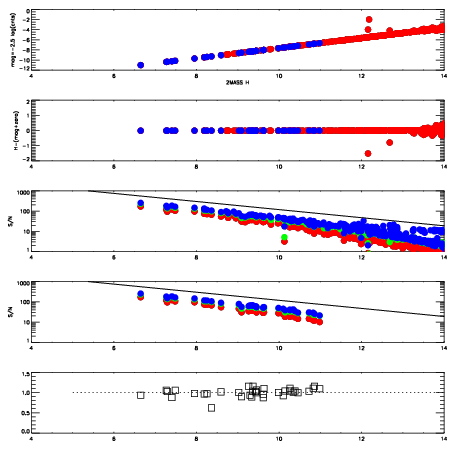
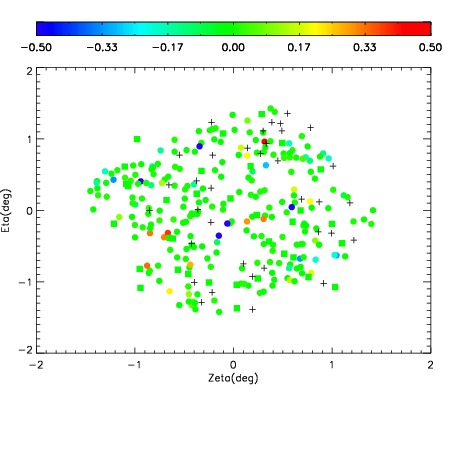
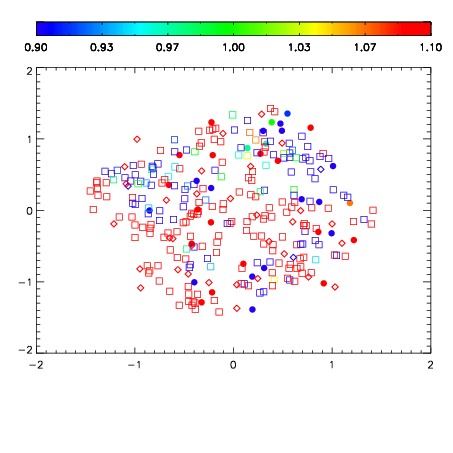
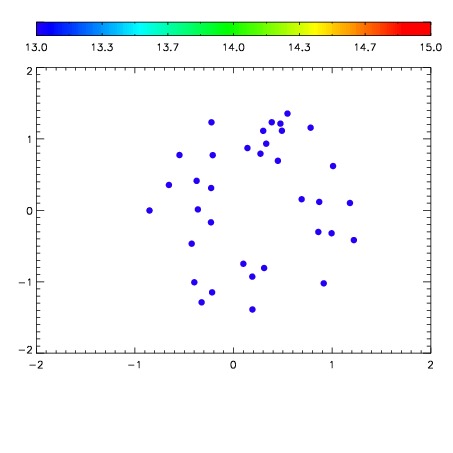

| Frame | Nreads | Zeropoints | Mag plots | Spatial mag deviation | Spatial sky 16325A emission deviations (filled: sky, open: star) | Spatial sky continuum emission | Spatial sky telluric CO2 absorption deviations (filled: H < 10) | |||||||||||||||||||||||
| 0 | 0 |
|
|
|
|
|
|
| IPAIR | NAME | SHIFT | NEWSHIFT | S/N | NAME | SHIFT | NEWSHIFT | S/N |
| 0 | 11960047 | 0.502993 | 0.00000 | 61.3345 | 11960041 | 0.00000 | 0.502993 | 83.0219 |
| 1 | 11960043 | 0.502917 | 7.59959e-05 | 70.7271 | 11960045 | 0.000174632 | 0.502818 | 104.295 |
| 2 | 11960046 | 0.502364 | 0.000629008 | 51.6391 | 11960048 | -0.00318278 | 0.506176 | 67.2151 |
| 3 | 11960042 | 0.501891 | 0.00110197 | 50.9027 | 11960044 | -0.000567487 | 0.503560 | 61.2414 |