| Red | Green | Blue | |
| z | 17.64 | ||
| znorm | Inf | ||
| sky | -Inf | -Inf | -Inf |
| S/N | 5.4 | 11.7 | 12.3 |
| S/N(c) | 0.0 | 0.0 | 0.0 |
| SN(E/C) |
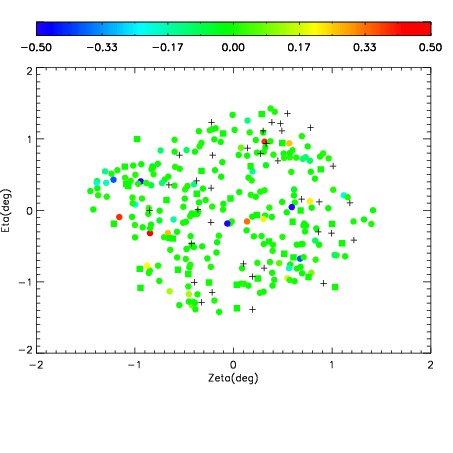
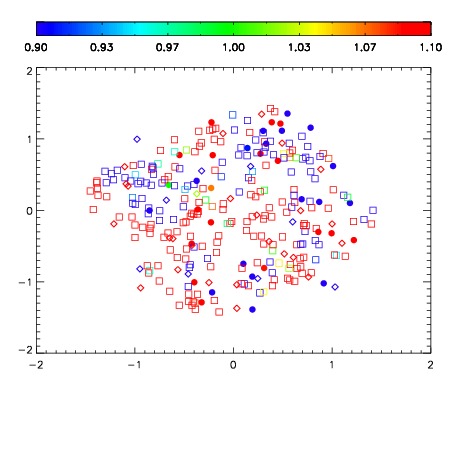
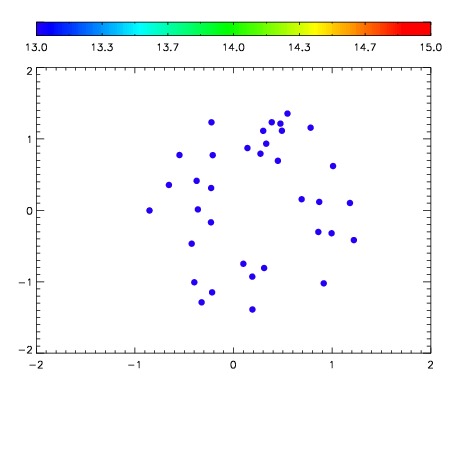

| Frame | Nreads | Zeropoints | Mag plots | Spatial mag deviation | Spatial sky 16325A emission deviations (filled: sky, open: star) | Spatial sky continuum emission | Spatial sky telluric CO2 absorption deviations (filled: H < 10) | |||||||||||||||||||||||
| 0 | 0 |
|
|
|
|
|
|
| IPAIR | NAME | SHIFT | NEWSHIFT | S/N | NAME | SHIFT | NEWSHIFT | S/N |
| 0 | 11990047 | 0.502798 | 0.00000 | 101.093 | 11990046 | 0.00000 | 0.502798 | 113.913 |
| 1 | 11990048 | 0.500741 | 0.00205702 | 58.8600 | 11990049 | -0.00409670 | 0.506895 | 67.9370 |
| 2 | 11990052 | 0.497203 | 0.00559503 | 40.7458 | 11990050 | -0.00508523 | 0.507883 | 64.5871 |
| 3 | 11990051 | 0.497578 | 0.00522003 | 40.6484 | 11990053 | -0.00843738 | 0.511235 | 26.4244 |