| Red | Green | Blue | |
| z | 17.64 | ||
| znorm | Inf | ||
| sky | -NaN | -Inf | -Inf |
| S/N | 22.3 | 38.3 | 48.2 |
| S/N(c) | 0.0 | 0.0 | 0.0 |
| SN(E/C) |
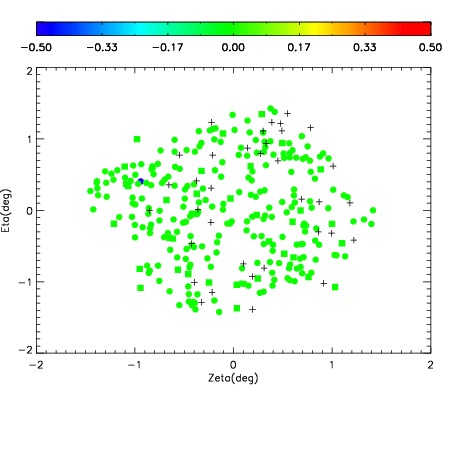

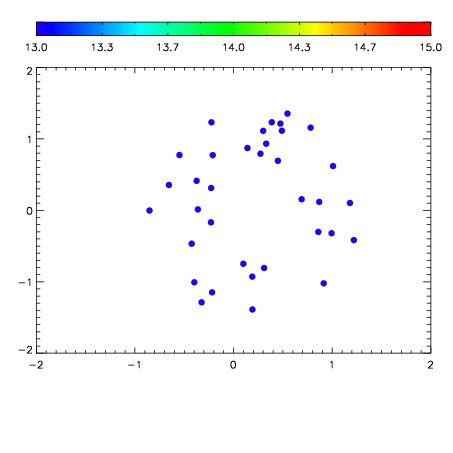

| Frame | Nreads | Zeropoints | Mag plots | Spatial mag deviation | Spatial sky 16325A emission deviations (filled: sky, open: star) | Spatial sky continuum emission | Spatial sky telluric CO2 absorption deviations (filled: H < 10) | |||||||||||||||||||||||
| 0 | 0 |
|
|
|
|
|
|
| IPAIR | NAME | SHIFT | NEWSHIFT | S/N | NAME | SHIFT | NEWSHIFT | S/N |
| 0 | 12000061 | 0.501287 | 0.00000 | 192.155 | 12000062 | -0.00402558 | 0.505313 | 196.187 |
| 1 | 12000060 | 0.500736 | 0.000550985 | 201.234 | 12000055 | 0.00000 | 0.501287 | 201.097 |
| 2 | 12000056 | 0.500461 | 0.000826001 | 195.729 | 12000059 | -0.00407446 | 0.505361 | 200.532 |
| 3 | 12000057 | 0.500929 | 0.000357985 | 191.663 | 12000058 | -0.00364504 | 0.504932 | 188.875 |