| Red | Green | Blue | |
| z | 17.64 | ||
| znorm | Inf | ||
| sky | -Inf | -NaN | -Inf |
| S/N | 20.7 | 35.9 | 42.1 |
| S/N(c) | 0.0 | 0.0 | 0.0 |
| SN(E/C) |
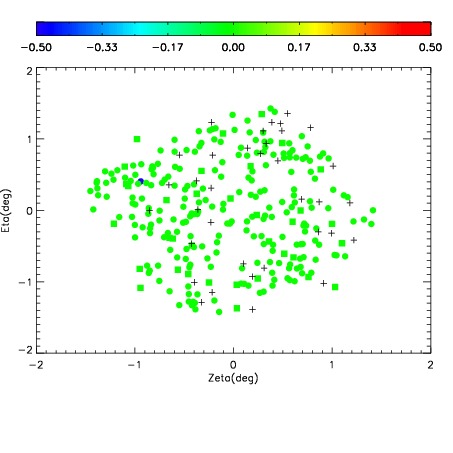
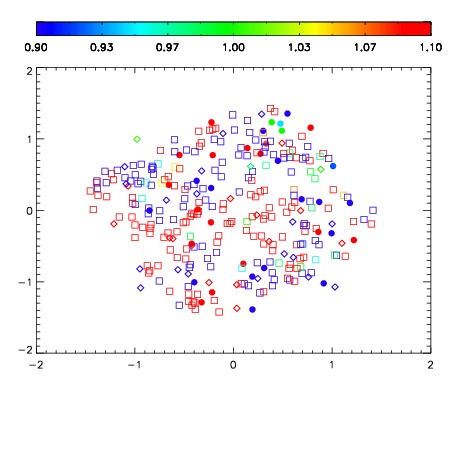
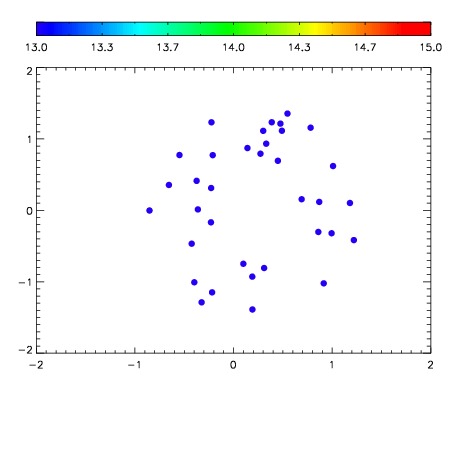

| Frame | Nreads | Zeropoints | Mag plots | Spatial mag deviation | Spatial sky 16325A emission deviations (filled: sky, open: star) | Spatial sky continuum emission | Spatial sky telluric CO2 absorption deviations (filled: H < 10) | |||||||||||||||||||||||
| 0 | 0 |
|
|
|
|
|
|
| IPAIR | NAME | SHIFT | NEWSHIFT | S/N | NAME | SHIFT | NEWSHIFT | S/N |
| 0 | 12010030 | 0.506172 | 0.00000 | 160.679 | 12010032 | -0.00237263 | 0.508545 | 168.656 |
| 1 | 12010035 | 0.504585 | 0.00158697 | 196.338 | 12010036 | -0.00266561 | 0.508838 | 200.984 |
| 2 | 12010034 | 0.504780 | 0.00139201 | 189.245 | 12010033 | -0.00189733 | 0.508069 | 183.099 |
| 3 | 12010031 | 0.505857 | 0.000315011 | 145.617 | 12010029 | 0.00000 | 0.506172 | 150.074 |