| Red | Green | Blue | |
| z | 17.64 | ||
| znorm | Inf | ||
| sky | -Inf | -Inf | -Inf |
| S/N | 17.6 | 31.2 | 34.3 |
| S/N(c) | 0.0 | 0.0 | 0.0 |
| SN(E/C) |

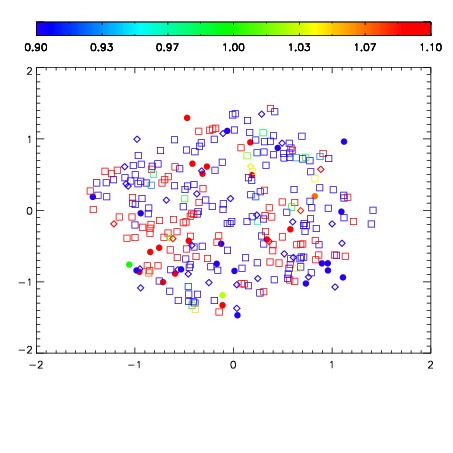
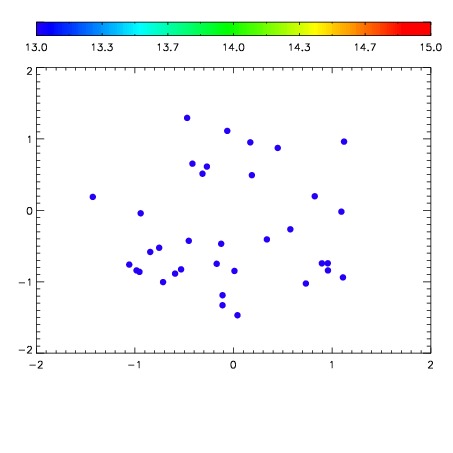

| Frame | Nreads | Zeropoints | Mag plots | Spatial mag deviation | Spatial sky 16325A emission deviations (filled: sky, open: star) | Spatial sky continuum emission | Spatial sky telluric CO2 absorption deviations (filled: H < 10) | |||||||||||||||||||||||
| 0 | 0 |
|
|
|
|
|
|
| IPAIR | NAME | SHIFT | NEWSHIFT | S/N | NAME | SHIFT | NEWSHIFT | S/N |
| 0 | 12220012 | 0.498925 | 0.00000 | 228.122 | 12220014 | -0.00292595 | 0.501851 | 217.999 |
| 1 | 12220013 | 0.498155 | 0.000770003 | 231.476 | 12220011 | 0.00000 | 0.498925 | 223.047 |
| 2 | 12220017 | 0.495966 | 0.00295901 | 25.9832 | 12220015 | -0.00287880 | 0.501804 | 128.631 |
| 3 | 12220016 | 0.495035 | 0.00389001 | 11.6623 | 12220018 | -0.00267418 | 0.501599 | 44.8336 |