| Red | Green | Blue | |
| z | 17.64 | ||
| znorm | Inf | ||
| sky | -NaN | -Inf | -Inf |
| S/N | 24.3 | 40.7 | 48.8 |
| S/N(c) | 0.0 | 0.0 | 0.0 |
| SN(E/C) |

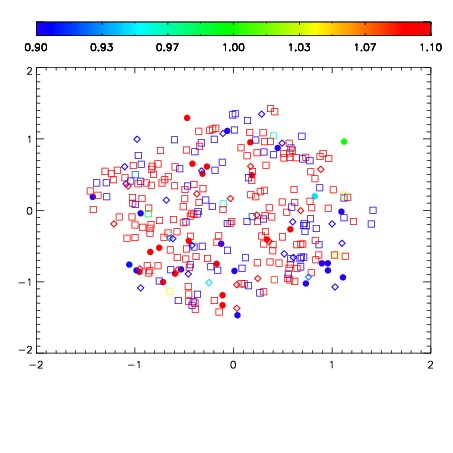
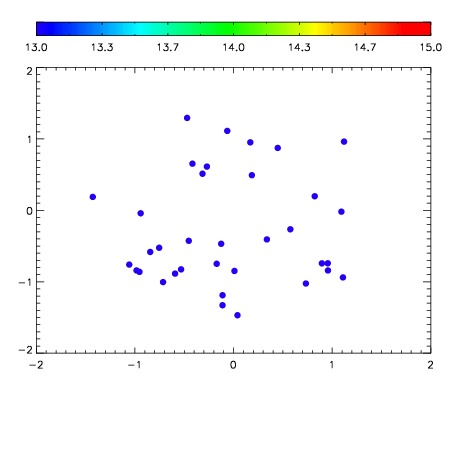

| Frame | Nreads | Zeropoints | Mag plots | Spatial mag deviation | Spatial sky 16325A emission deviations (filled: sky, open: star) | Spatial sky continuum emission | Spatial sky telluric CO2 absorption deviations (filled: H < 10) | |||||||||||||||||||||||
| 0 | 0 |
|
|
|
|
|
|
| IPAIR | NAME | SHIFT | NEWSHIFT | S/N | NAME | SHIFT | NEWSHIFT | S/N |
| 0 | 12230028 | 0.499040 | 0.00000 | 217.469 | 12230030 | -0.00223365 | 0.501274 | 226.255 |
| 1 | 12230031 | 0.497473 | 0.00156701 | 225.666 | 12230029 | -0.00130661 | 0.500347 | 227.636 |
| 2 | 12230027 | 0.498834 | 0.000205994 | 216.946 | 12230033 | 0.000176342 | 0.498864 | 223.348 |
| 3 | 12230032 | 0.497505 | 0.00153500 | 216.335 | 12230026 | 0.00000 | 0.499040 | 216.297 |