| Red | Green | Blue | |
| z | 17.64 | ||
| znorm | Inf | ||
| sky | -NaN | -NaN | -Inf |
| S/N | 19.1 | 35.1 | 40.8 |
| S/N(c) | 0.0 | 0.0 | 0.0 |
| SN(E/C) |
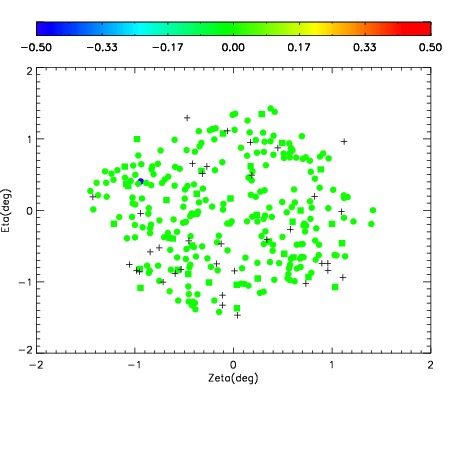
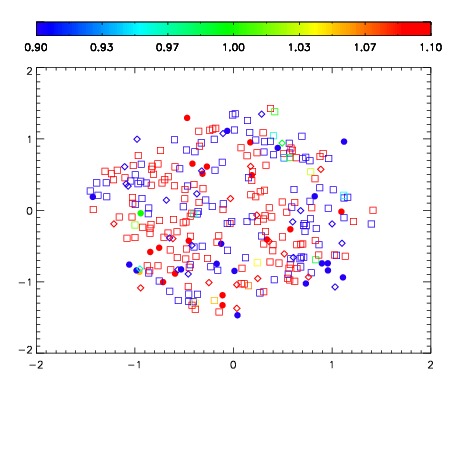
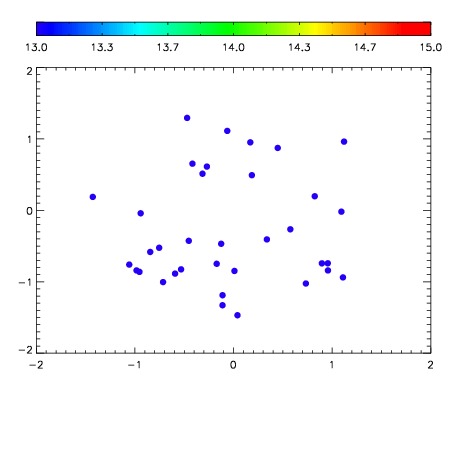

| Frame | Nreads | Zeropoints | Mag plots | Spatial mag deviation | Spatial sky 16325A emission deviations (filled: sky, open: star) | Spatial sky continuum emission | Spatial sky telluric CO2 absorption deviations (filled: H < 10) | |||||||||||||||||||||||
| 0 | 0 |
|
|
|
|
|
|
| IPAIR | NAME | SHIFT | NEWSHIFT | S/N | NAME | SHIFT | NEWSHIFT | S/N |
| 0 | 12240045 | 0.492884 | 0.00000 | 203.165 | 12240047 | -0.000866727 | 0.493751 | 192.835 |
| 1 | 12240050 | 0.492164 | 0.000720024 | 216.612 | 12240051 | -0.000911193 | 0.493795 | 208.021 |
| 2 | 12240046 | 0.492709 | 0.000174999 | 199.250 | 12240044 | 0.00000 | 0.492884 | 189.230 |
| 3 | 12240049 | 0.492848 | 3.60012e-05 | 193.896 | 12240048 | -0.000727071 | 0.493611 | 176.532 |