| Red | Green | Blue | |
| z | 17.64 | ||
| znorm | Inf | ||
| sky | -NaN | -Inf | -Inf |
| S/N | 23.5 | 41.6 | 49.1 |
| S/N(c) | 0.0 | 0.0 | 0.0 |
| SN(E/C) |
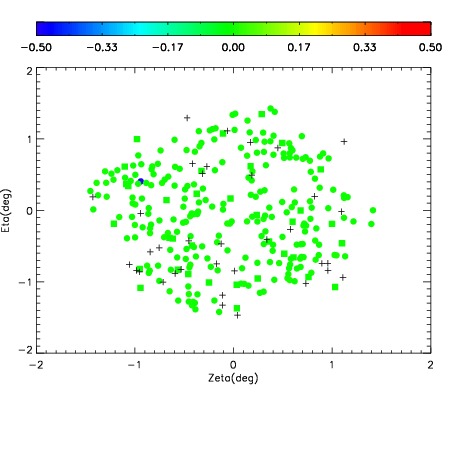
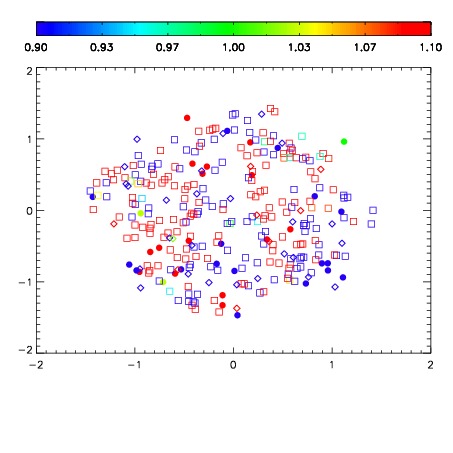
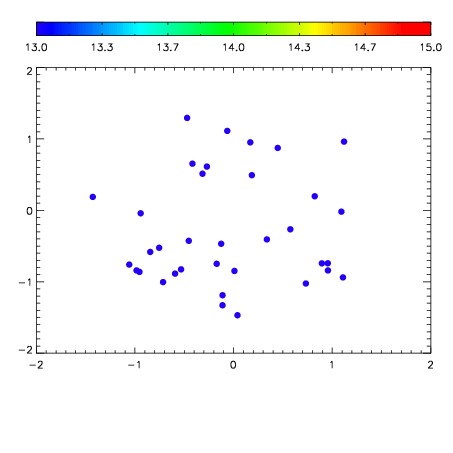

| Frame | Nreads | Zeropoints | Mag plots | Spatial mag deviation | Spatial sky 16325A emission deviations (filled: sky, open: star) | Spatial sky continuum emission | Spatial sky telluric CO2 absorption deviations (filled: H < 10) | |||||||||||||||||||||||
| 0 | 0 |
|
|
|
|
|
|
| IPAIR | NAME | SHIFT | NEWSHIFT | S/N | NAME | SHIFT | NEWSHIFT | S/N |
| 0 | 12250054 | 0.494331 | 0.00000 | 226.357 | 12250055 | -0.000130782 | 0.494462 | 227.509 |
| 1 | 12250053 | 0.493958 | 0.000373006 | 225.146 | 12250052 | 0.00155211 | 0.492779 | 223.873 |
| 2 | 12250050 | 0.493609 | 0.000721991 | 219.324 | 12250051 | 0.00214600 | 0.492185 | 214.688 |
| 3 | 12250049 | 0.493995 | 0.000335991 | 209.348 | 12250048 | 0.00000 | 0.494331 | 204.268 |