| Red | Green | Blue | |
| z | 17.65 | ||
| znorm | Inf | ||
| sky | -Inf | -Inf | -Inf |
| S/N | 7.5 | 15.5 | 18.2 |
| S/N(c) | 0.0 | 0.0 | 0.0 |
| SN(E/C) |
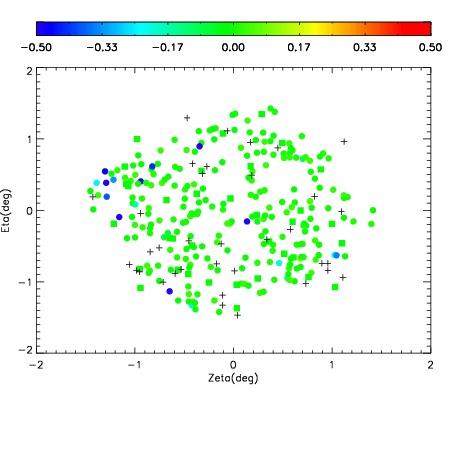
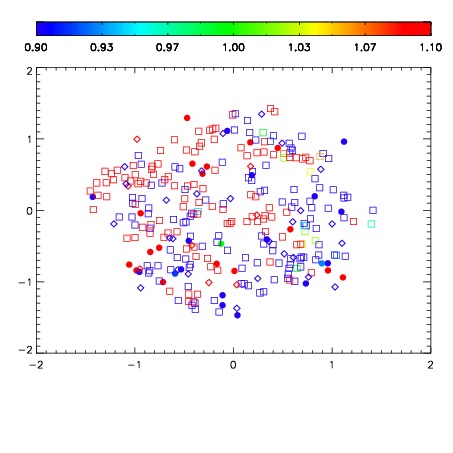
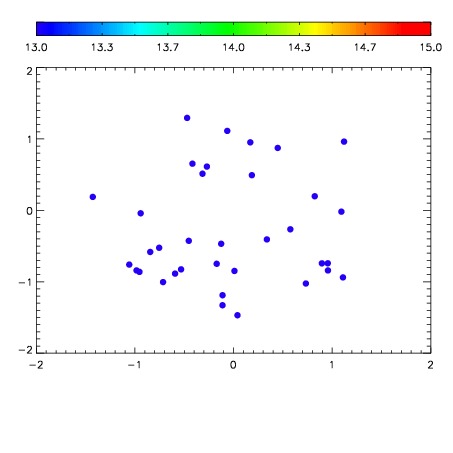

| Frame | Nreads | Zeropoints | Mag plots | Spatial mag deviation | Spatial sky 16325A emission deviations (filled: sky, open: star) | Spatial sky continuum emission | Spatial sky telluric CO2 absorption deviations (filled: H < 10) | |||||||||||||||||||||||
| 0 | 0 |
|
|
|
|
|
|
| IPAIR | NAME | SHIFT | NEWSHIFT | S/N | NAME | SHIFT | NEWSHIFT | S/N |
| 0 | 12260053 | 0.492148 | 0.00000 | 94.7004 | 12260051 | -0.000587943 | 0.492736 | 94.8097 |
| 1 | 12260054 | 0.491799 | 0.000349015 | 96.4815 | 12260052 | 0.000733697 | 0.491414 | 95.1625 |
| 2 | 12260050 | 0.491661 | 0.000487000 | 94.4814 | 12260055 | 0.000430442 | 0.491718 | 92.9285 |
| 3 | 12260049 | 0.490715 | 0.00143301 | 92.8047 | 12260048 | 0.00000 | 0.492148 | 90.8242 |