| Red | Green | Blue | |
| z | 17.64 | ||
| znorm | Inf | ||
| sky | -Inf | -Inf | -Inf |
| S/N | 18.7 | 34.9 | 38.5 |
| S/N(c) | 0.0 | 0.0 | 0.0 |
| SN(E/C) |

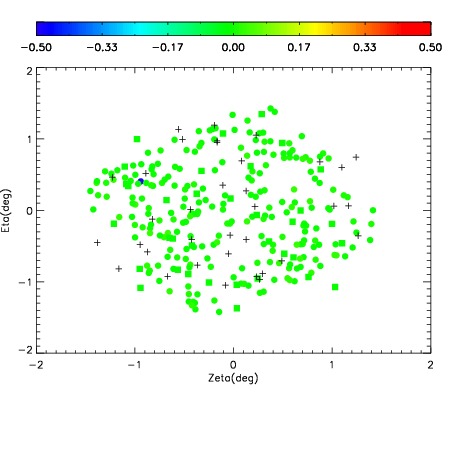
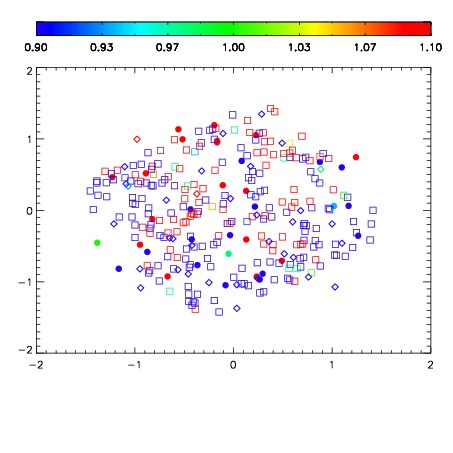
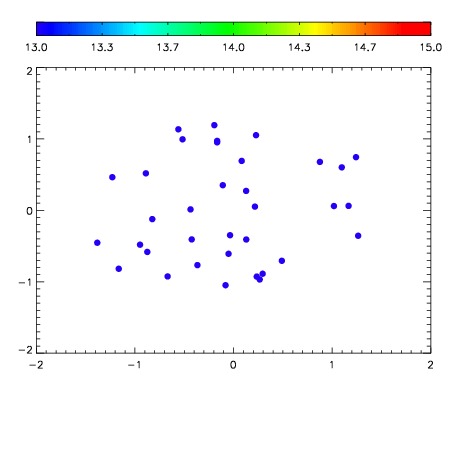

| Frame | Nreads | Zeropoints | Mag plots | Spatial mag deviation | Spatial sky 16325A emission deviations (filled: sky, open: star) | Spatial sky continuum emission | Spatial sky telluric CO2 absorption deviations (filled: H < 10) | |||||||||||||||||||||||
| 0 | 0 |
|
|
|
|
|
|
| IPAIR | NAME | SHIFT | NEWSHIFT | S/N | NAME | SHIFT | NEWSHIFT | S/N |
| 0 | 12500021 | 0.496244 | 0.00000 | 159.602 | 12500019 | -0.00342102 | 0.499665 | 152.095 |
| 1 | 12500020 | 0.494828 | 0.00141603 | 162.718 | 12500022 | -0.00193450 | 0.498179 | 165.234 |
| 2 | 12500017 | 0.494018 | 0.00222602 | 140.733 | 12500018 | -0.00404977 | 0.500294 | 130.494 |
| 3 | 12500016 | 0.494215 | 0.00202900 | 129.266 | 12500015 | -0.00373114 | 0.499975 | 126.132 |
| 4 | 12500012 | 0.492957 | 0.00328702 | 113.164 | 12500014 | -0.00382889 | 0.500073 | 125.897 |
| 5 | 12500013 | 0.494080 | 0.00216401 | 93.8390 | 12500011 | 0.00000 | 0.496244 | 116.312 |