| Red | Green | Blue | |
| z | 17.64 | ||
| znorm | Inf | ||
| sky | -Inf | -Inf | -Inf |
| S/N | 20.5 | 35.3 | 43.6 |
| S/N(c) | 0.0 | 0.0 | 0.0 |
| SN(E/C) |
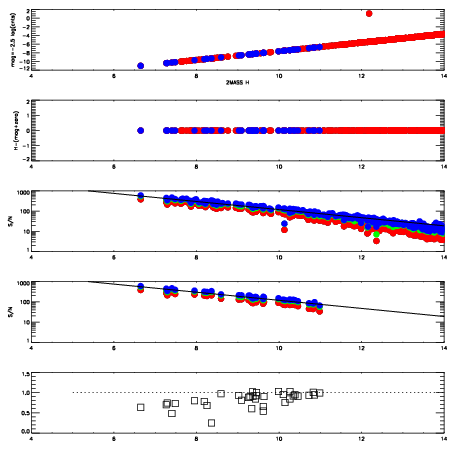
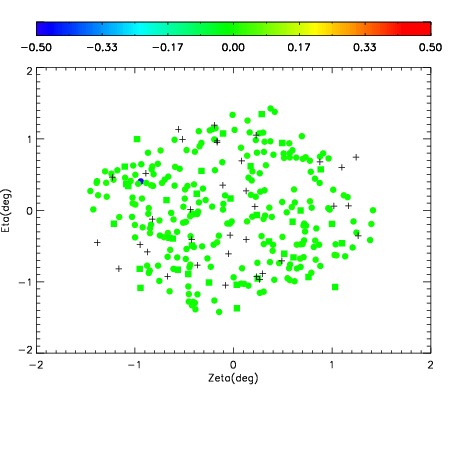
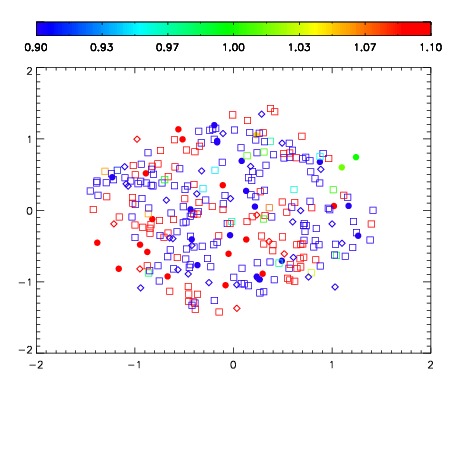
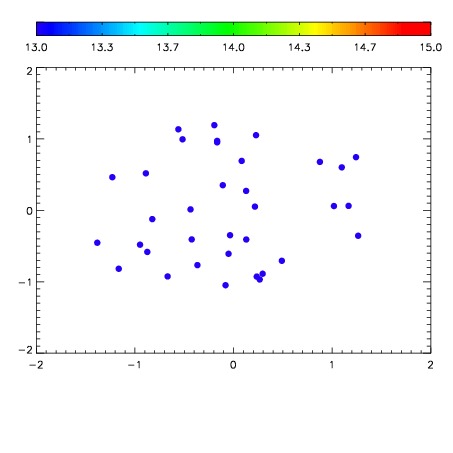

| Frame | Nreads | Zeropoints | Mag plots | Spatial mag deviation | Spatial sky 16325A emission deviations (filled: sky, open: star) | Spatial sky continuum emission | Spatial sky telluric CO2 absorption deviations (filled: H < 10) | |||||||||||||||||||||||
| 0 | 0 |
|
|
|
|
|
|
| IPAIR | NAME | SHIFT | NEWSHIFT | S/N | NAME | SHIFT | NEWSHIFT | S/N |
| 0 | 12520035 | 0.490970 | 0.00000 | 145.622 | 12520036 | -0.00200618 | 0.492976 | 142.936 |
| 1 | 12520038 | 0.489592 | 0.00137800 | 178.989 | 12520040 | -0.00247230 | 0.493442 | 177.790 |
| 2 | 12520039 | 0.490063 | 0.000906974 | 177.777 | 12520037 | -0.00262854 | 0.493599 | 168.078 |
| 3 | 12520034 | 0.490666 | 0.000303984 | 143.664 | 12520033 | 0.00000 | 0.490970 | 139.667 |