| Red | Green | Blue | |
| z | 17.64 | ||
| znorm | Inf | ||
| sky | -Inf | -Inf | -Inf |
| S/N | 25.6 | 44.2 | 49.8 |
| S/N(c) | 0.0 | 0.0 | 0.0 |
| SN(E/C) |
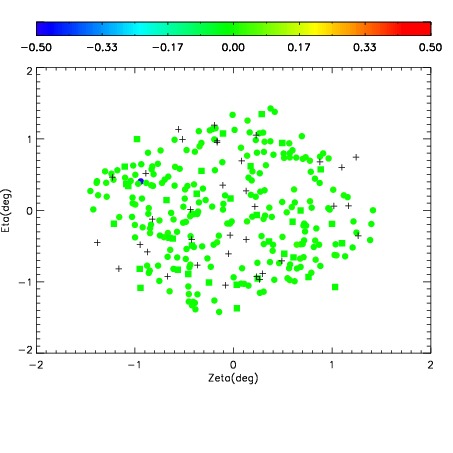
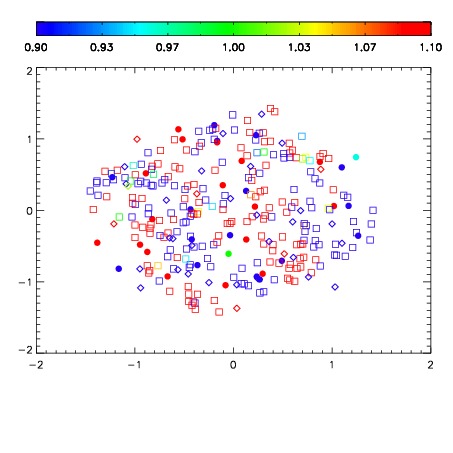


| Frame | Nreads | Zeropoints | Mag plots | Spatial mag deviation | Spatial sky 16325A emission deviations (filled: sky, open: star) | Spatial sky continuum emission | Spatial sky telluric CO2 absorption deviations (filled: H < 10) | |||||||||||||||||||||||
| 0 | 0 |
|
|
|
|
|
|
| IPAIR | NAME | SHIFT | NEWSHIFT | S/N | NAME | SHIFT | NEWSHIFT | S/N |
| 0 | 12530039 | 0.491913 | 0.00000 | 195.579 | 12530040 | -0.00199227 | 0.493905 | 197.889 |
| 1 | 12530038 | 0.490673 | 0.00123999 | 193.690 | 12530037 | 0.00000 | 0.491913 | 196.830 |
| 2 | 12530043 | 0.490728 | 0.00118500 | 191.920 | 12530041 | -0.00166475 | 0.493578 | 192.689 |
| 3 | 12530042 | 0.490123 | 0.00178999 | 189.759 | 12530044 | -0.000395766 | 0.492309 | 186.403 |