| Red | Green | Blue | |
| z | 17.64 | ||
| znorm | Inf | ||
| sky | -Inf | -Inf | -Inf |
| S/N | 8.4 | 17.3 | 18.3 |
| S/N(c) | 0.0 | 0.0 | 0.0 |
| SN(E/C) |
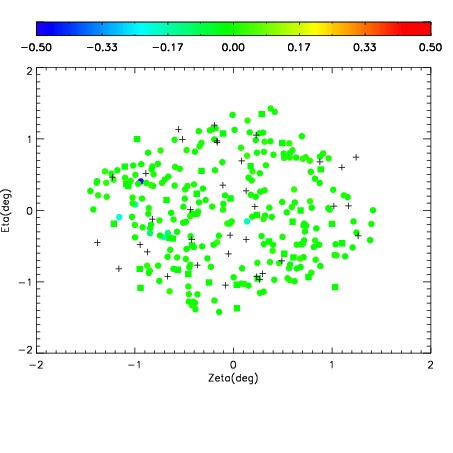
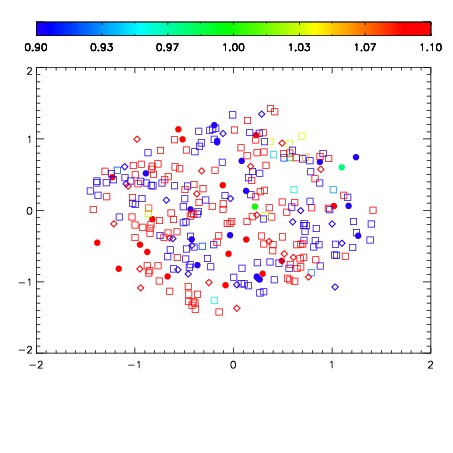


| Frame | Nreads | Zeropoints | Mag plots | Spatial mag deviation | Spatial sky 16325A emission deviations (filled: sky, open: star) | Spatial sky continuum emission | Spatial sky telluric CO2 absorption deviations (filled: H < 10) | |||||||||||||||||||||||
| 0 | 0 |
|
|
|
|
|
|
| IPAIR | NAME | SHIFT | NEWSHIFT | S/N | NAME | SHIFT | NEWSHIFT | S/N |
| 0 | 12540043 | 0.490792 | 0.00000 | 100.108 | 12540037 | 0.00000 | 0.490792 | 98.7901 |
| 1 | 12540039 | 0.489868 | 0.000924021 | 114.438 | 12540041 | -0.000288387 | 0.491080 | 114.512 |
| 2 | 12540038 | 0.489608 | 0.00118402 | 111.694 | 12540040 | -0.000269508 | 0.491062 | 107.700 |
| 3 | 12540042 | 0.490447 | 0.000344992 | 69.1352 | 12540044 | -0.00428149 | 0.495073 | 55.2917 |