| Red | Green | Blue | |
| z | 17.64 | ||
| znorm | Inf | ||
| sky | -Inf | -Inf | -Inf |
| S/N | 20.5 | 35.8 | 42.1 |
| S/N(c) | 0.0 | 0.0 | 0.0 |
| SN(E/C) |
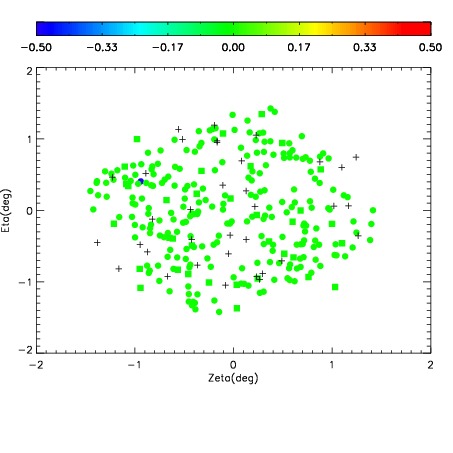
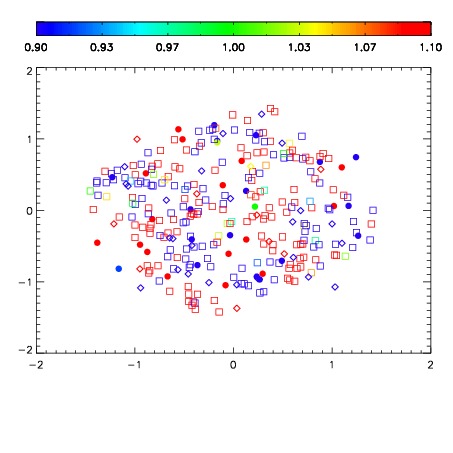
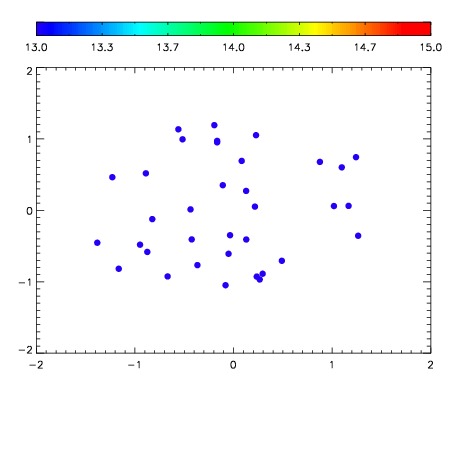

| Frame | Nreads | Zeropoints | Mag plots | Spatial mag deviation | Spatial sky 16325A emission deviations (filled: sky, open: star) | Spatial sky continuum emission | Spatial sky telluric CO2 absorption deviations (filled: H < 10) | |||||||||||||||||||||||
| 0 | 0 |
|
|
|
|
|
|
| IPAIR | NAME | SHIFT | NEWSHIFT | S/N | NAME | SHIFT | NEWSHIFT | S/N |
| 0 | 12550042 | 0.491011 | 0.00000 | 176.041 | 12550041 | -0.000998779 | 0.492010 | 169.528 |
| 1 | 12550043 | 0.490322 | 0.000689000 | 180.335 | 12550044 | -0.00326826 | 0.494279 | 178.161 |
| 2 | 12550039 | 0.490791 | 0.000220001 | 170.400 | 12550040 | -0.000948367 | 0.491959 | 167.139 |
| 3 | 12550038 | 0.490903 | 0.000108004 | 162.461 | 12550037 | 0.00000 | 0.491011 | 154.095 |