| Red | Green | Blue | |
| z | 17.64 | ||
| znorm | Inf | ||
| sky | -Inf | -Inf | -Inf |
| S/N | 21.8 | 38.0 | 44.3 |
| S/N(c) | 0.0 | 0.0 | 0.0 |
| SN(E/C) |
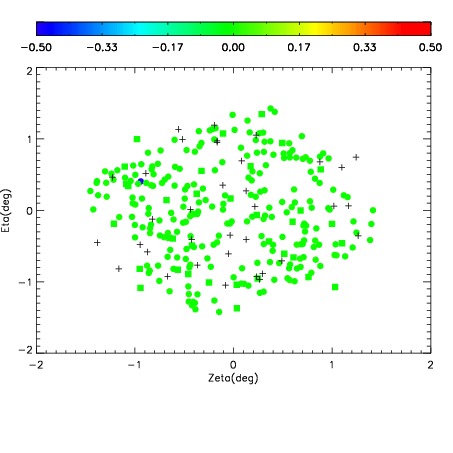
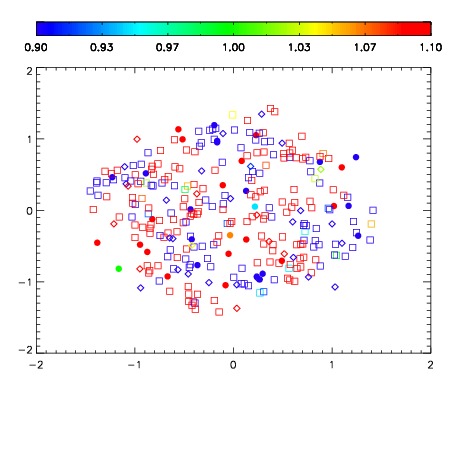
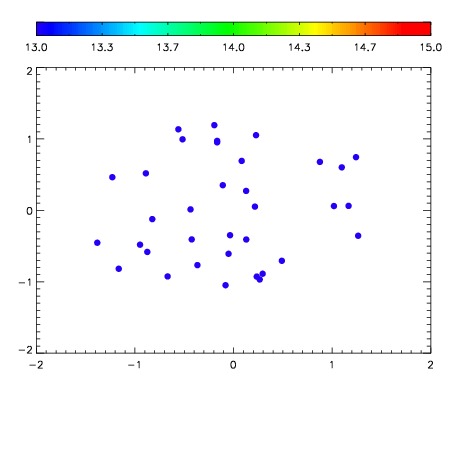

| Frame | Nreads | Zeropoints | Mag plots | Spatial mag deviation | Spatial sky 16325A emission deviations (filled: sky, open: star) | Spatial sky continuum emission | Spatial sky telluric CO2 absorption deviations (filled: H < 10) | |||||||||||||||||||||||
| 0 | 0 |
|
|
|
|
|
|
| IPAIR | NAME | SHIFT | NEWSHIFT | S/N | NAME | SHIFT | NEWSHIFT | S/N |
| 0 | 12560043 | 0.492036 | 0.00000 | 176.547 | 12560044 | 0.00362109 | 0.488415 | 171.825 |
| 1 | 12560038 | 0.489338 | 0.00269800 | 207.276 | 12560037 | 0.00000 | 0.492036 | 207.534 |
| 2 | 12560039 | 0.490024 | 0.00201201 | 172.683 | 12560041 | -0.00221462 | 0.494251 | 165.217 |
| 3 | 12560042 | 0.491972 | 6.40154e-05 | 171.466 | 12560040 | -0.00215397 | 0.494190 | 156.051 |