| Red | Green | Blue | |
| z | 17.64 | ||
| znorm | Inf | ||
| sky | -Inf | -Inf | -Inf |
| S/N | 20.8 | 35.7 | 40.7 |
| S/N(c) | 0.0 | 0.0 | 0.0 |
| SN(E/C) |
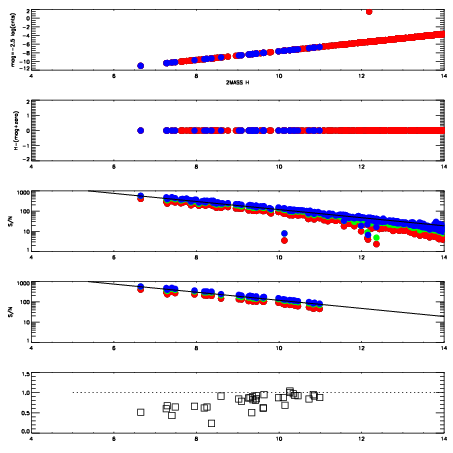
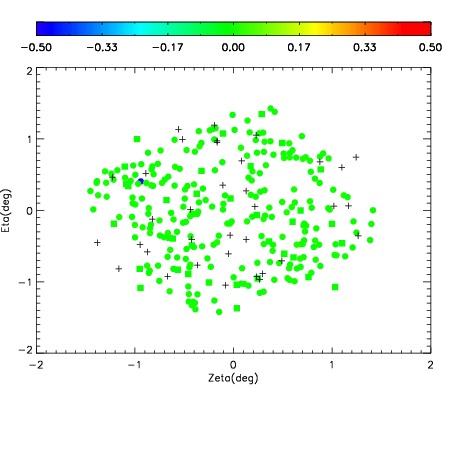
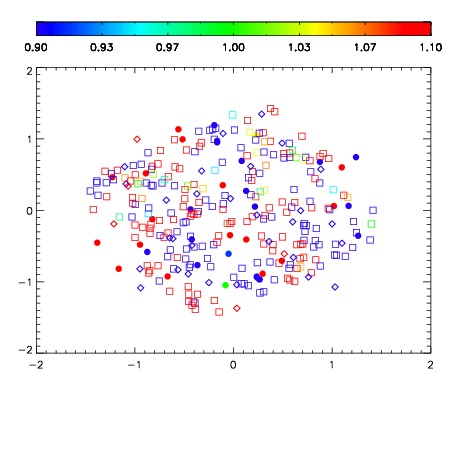
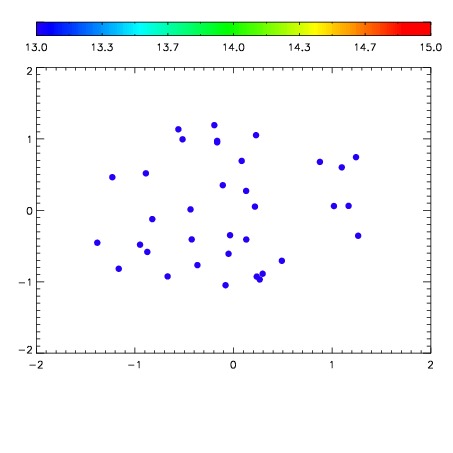

| Frame | Nreads | Zeropoints | Mag plots | Spatial mag deviation | Spatial sky 16325A emission deviations (filled: sky, open: star) | Spatial sky continuum emission | Spatial sky telluric CO2 absorption deviations (filled: H < 10) | |||||||||||||||||||||||
| 0 | 0 |
|
|
|
|
|
|
| IPAIR | NAME | SHIFT | NEWSHIFT | S/N | NAME | SHIFT | NEWSHIFT | S/N |
| 0 | 12570035 | 0.484901 | 0.00000 | 126.723 | 12570036 | -0.00325735 | 0.488158 | 166.912 |
| 1 | 12570038 | 0.482435 | 0.00246602 | 203.343 | 12570037 | -0.00414403 | 0.489045 | 203.819 |
| 2 | 12570039 | 0.482922 | 0.00197902 | 202.230 | 12570040 | -0.00990713 | 0.494808 | 199.716 |
| 3 | 12570034 | 0.484217 | 0.000684023 | 91.0764 | 12570033 | 0.00000 | 0.484901 | 102.011 |