| Red | Green | Blue | |
| z | 17.64 | ||
| znorm | Inf | ||
| sky | -Inf | -Inf | -Inf |
| S/N | 25.9 | 43.9 | 49.6 |
| S/N(c) | 0.0 | 0.0 | 0.0 |
| SN(E/C) |
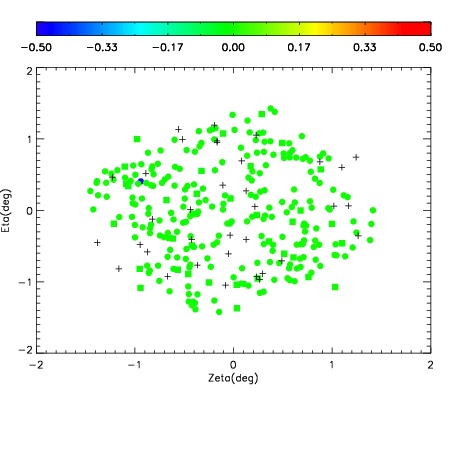
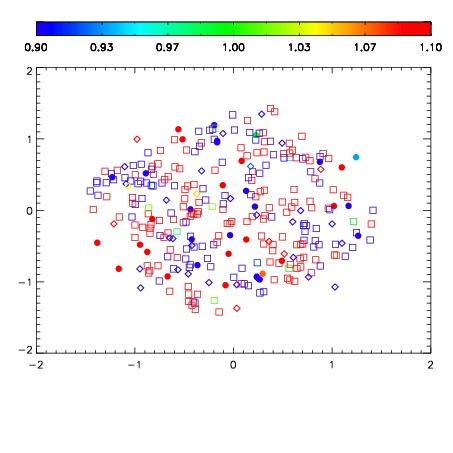


| Frame | Nreads | Zeropoints | Mag plots | Spatial mag deviation | Spatial sky 16325A emission deviations (filled: sky, open: star) | Spatial sky continuum emission | Spatial sky telluric CO2 absorption deviations (filled: H < 10) | |||||||||||||||||||||||
| 0 | 0 |
|
|
|
|
|
|
| IPAIR | NAME | SHIFT | NEWSHIFT | S/N | NAME | SHIFT | NEWSHIFT | S/N |
| 0 | 12580028 | 0.493006 | 0.00000 | 201.418 | 12580026 | 0.000343260 | 0.492663 | 199.316 |
| 1 | 12580027 | 0.492310 | 0.000696003 | 201.681 | 12580022 | 0.00000 | 0.493006 | 201.023 |
| 2 | 12580023 | 0.490096 | 0.00290999 | 196.650 | 12580025 | -0.000718344 | 0.493724 | 198.116 |
| 3 | 12580024 | 0.491281 | 0.00172499 | 186.367 | 12580029 | 0.00320258 | 0.489803 | 196.351 |