| Red | Green | Blue | |
| z | 17.64 | ||
| znorm | Inf | ||
| sky | -NaN | -Inf | -Inf |
| S/N | 37.2 | 51.2 | 50.9 |
| S/N(c) | 0.0 | 0.0 | 0.0 |
| SN(E/C) |
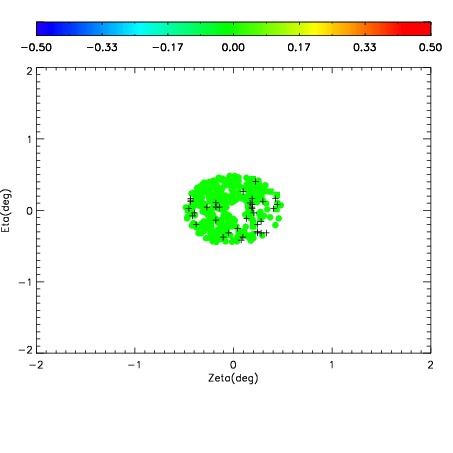
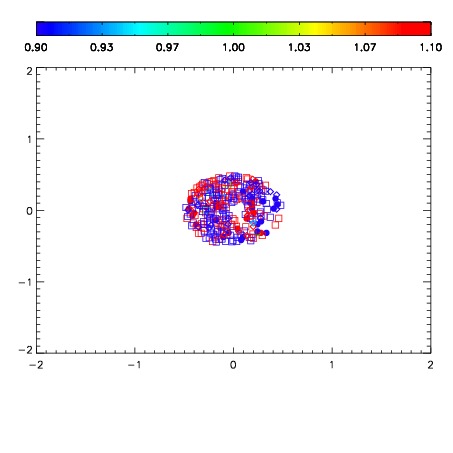
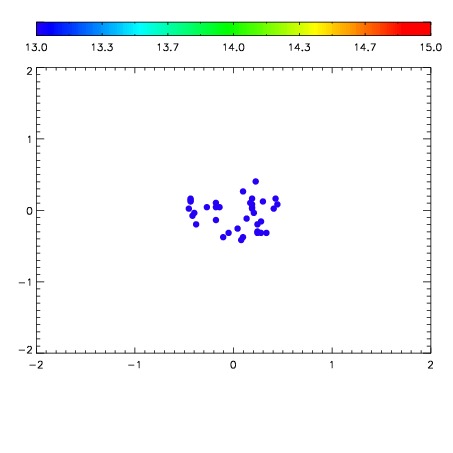

| Frame | Nreads | Zeropoints | Mag plots | Spatial mag deviation | Spatial sky 16325A emission deviations (filled: sky, open: star) | Spatial sky continuum emission | Spatial sky telluric CO2 absorption deviations (filled: H < 10) | |||||||||||||||||||||||
| 0 | 0 |
|
|
|
|
|
|
| IPAIR | NAME | SHIFT | NEWSHIFT | S/N | NAME | SHIFT | NEWSHIFT | S/N |
| 0 | 12420013 | 0.494316 | 0.00000 | 232.444 | 12420018 | -0.00276613 | 0.497082 | 235.608 |
| 1 | 12420017 | 0.491932 | 0.00238401 | 231.030 | 12420014 | -0.00374641 | 0.498062 | 233.724 |
| 2 | 12420012 | 0.492862 | 0.00145403 | 229.918 | 12420015 | -0.00432179 | 0.498638 | 233.121 |
| 3 | 12420016 | 0.491247 | 0.00306901 | 223.336 | 12420011 | 0.00000 | 0.494316 | 221.072 |