| Red | Green | Blue | |
| z | 17.64 | ||
| znorm | Inf | ||
| sky | -Inf | -NaN | -Inf |
| S/N | 25.2 | 43.0 | 44.1 |
| S/N(c) | 0.0 | 0.0 | 0.0 |
| SN(E/C) |
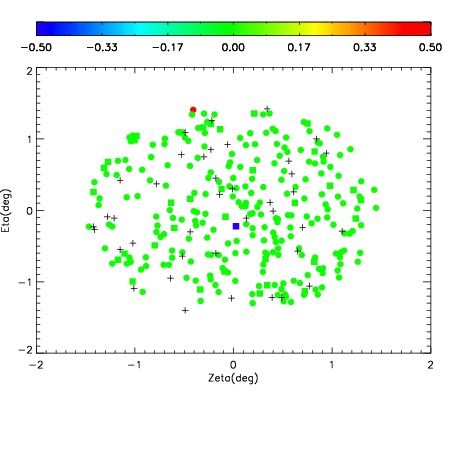
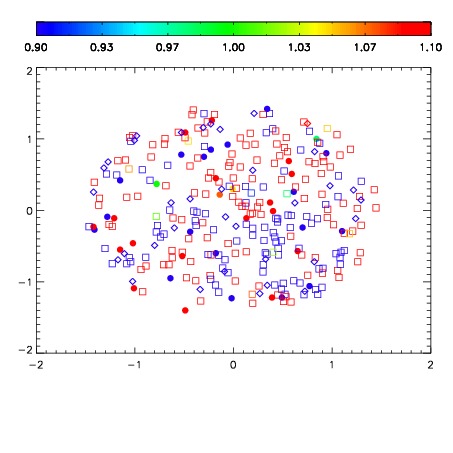
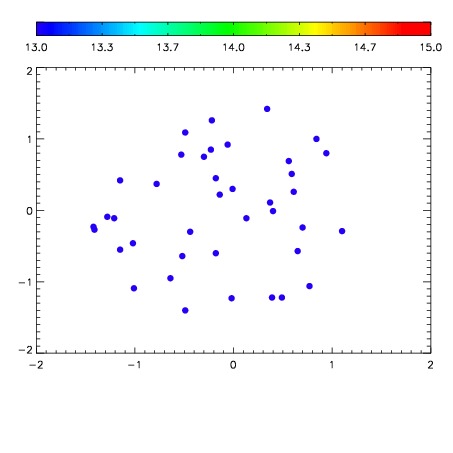

| Frame | Nreads | Zeropoints | Mag plots | Spatial mag deviation | Spatial sky 16325A emission deviations (filled: sky, open: star) | Spatial sky continuum emission | Spatial sky telluric CO2 absorption deviations (filled: H < 10) | |||||||||||||||||||||||
| 0 | 0 |
|
|
|
|
|
|
| IPAIR | NAME | SHIFT | NEWSHIFT | S/N | NAME | SHIFT | NEWSHIFT | S/N |
| 0 | 12720055 | 0.491806 | 0.00000 | 206.317 | 12720056 | -0.000294112 | 0.492100 | 208.375 |
| 1 | 12720054 | 0.490864 | 0.000941992 | 202.513 | 12720049 | 0.00000 | 0.491806 | 203.083 |
| 2 | 12720050 | 0.487704 | 0.00410199 | 199.029 | 12720053 | -0.00140120 | 0.493207 | 194.335 |
| 3 | 12720051 | 0.487348 | 0.00445801 | 197.145 | 12720052 | -0.00146838 | 0.493274 | 192.241 |