| Red | Green | Blue | |
| z | 17.64 | ||
| znorm | Inf | ||
| sky | -Inf | -Inf | -Inf |
| S/N | 29.5 | 46.5 | 46.7 |
| S/N(c) | 0.0 | 0.0 | 0.0 |
| SN(E/C) |
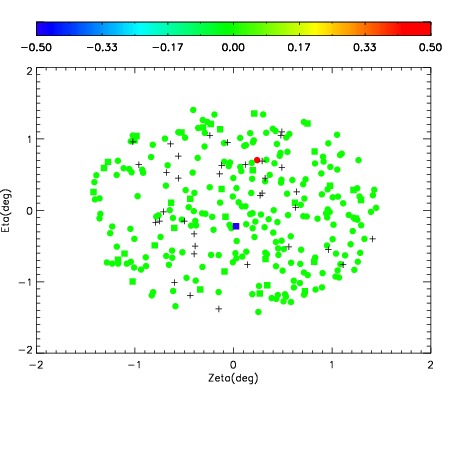
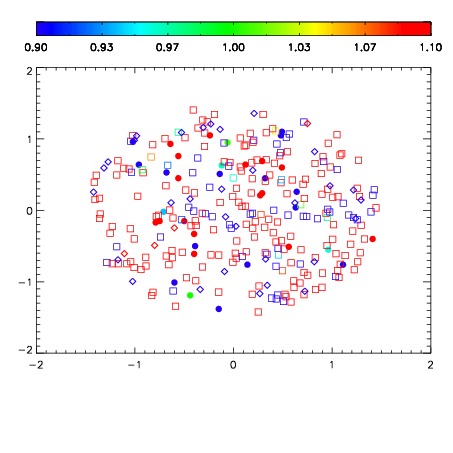
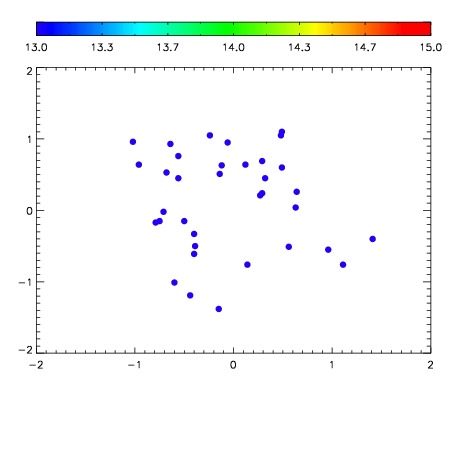

| Frame | Nreads | Zeropoints | Mag plots | Spatial mag deviation | Spatial sky 16325A emission deviations (filled: sky, open: star) | Spatial sky continuum emission | Spatial sky telluric CO2 absorption deviations (filled: H < 10) | |||||||||||||||||||||||
| 0 | 0 |
|
|
|
|
|
|
| IPAIR | NAME | SHIFT | NEWSHIFT | S/N | NAME | SHIFT | NEWSHIFT | S/N |
| 0 | 12580039 | 0.492241 | 0.00000 | 198.250 | 12580037 | 0.000899711 | 0.491341 | 197.836 |
| 1 | 12580035 | 0.491537 | 0.000703990 | 220.941 | 12580033 | 0.00000 | 0.492241 | 218.933 |
| 2 | 12580034 | 0.490703 | 0.00153801 | 220.806 | 12580040 | 0.00152808 | 0.490713 | 217.167 |
| 3 | 12580038 | 0.490935 | 0.00130600 | 213.139 | 12580036 | 6.21731e-05 | 0.492179 | 214.809 |