| Red | Green | Blue | |
| z | 17.64 | ||
| znorm | Inf | ||
| sky | -Inf | -Inf | -Inf |
| S/N | 26.2 | 44.2 | 49.2 |
| S/N(c) | 0.0 | 0.0 | 0.0 |
| SN(E/C) |
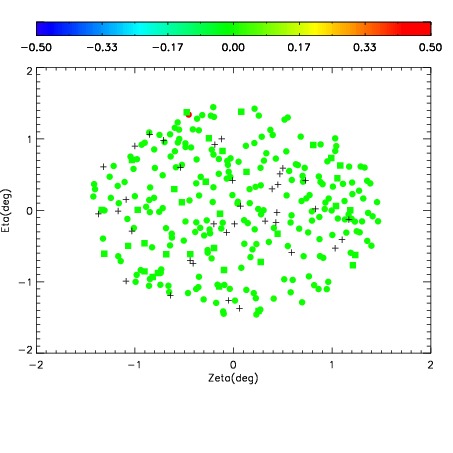
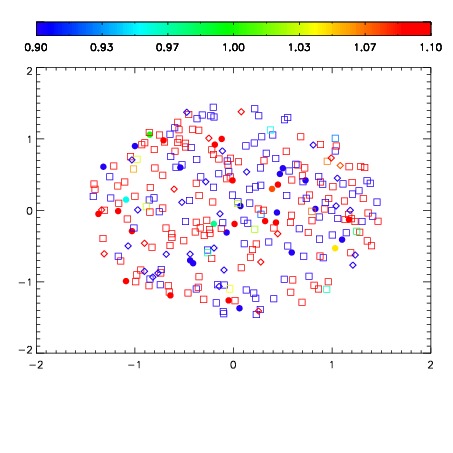
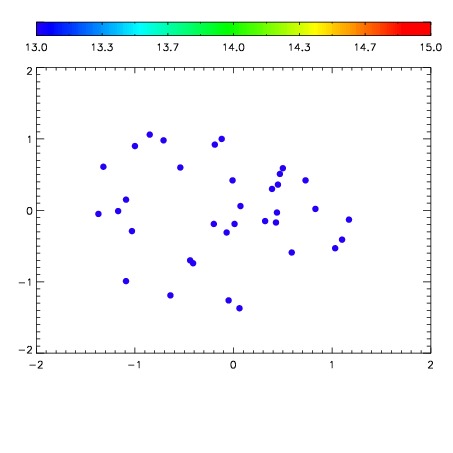

| Frame | Nreads | Zeropoints | Mag plots | Spatial mag deviation | Spatial sky 16325A emission deviations (filled: sky, open: star) | Spatial sky continuum emission | Spatial sky telluric CO2 absorption deviations (filled: H < 10) | |||||||||||||||||||||||
| 0 | 0 |
|
|
|
|
|
|
| IPAIR | NAME | SHIFT | NEWSHIFT | S/N | NAME | SHIFT | NEWSHIFT | S/N |
| 0 | 12670028 | 0.489512 | 0.00000 | 144.351 | 12670022 | 0.00000 | 0.489512 | 158.877 |
| 1 | 12670023 | 0.489130 | 0.000382006 | 168.111 | 12670026 | 5.35144e-05 | 0.489458 | 182.787 |
| 2 | 12670024 | 0.488340 | 0.00117201 | 166.101 | 12670025 | -0.000133324 | 0.489645 | 181.694 |
| 3 | 12670027 | 0.488758 | 0.000753999 | 163.965 | 12670029 | 0.000197095 | 0.489315 | 169.287 |