| Red | Green | Blue | |
| z | 17.64 | ||
| znorm | Inf | ||
| sky | -Inf | -Inf | -Inf |
| S/N | 19.1 | 32.1 | 34.5 |
| S/N(c) | 0.0 | 0.0 | 0.0 |
| SN(E/C) |
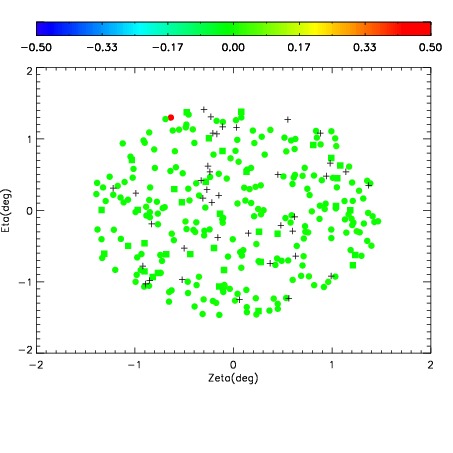
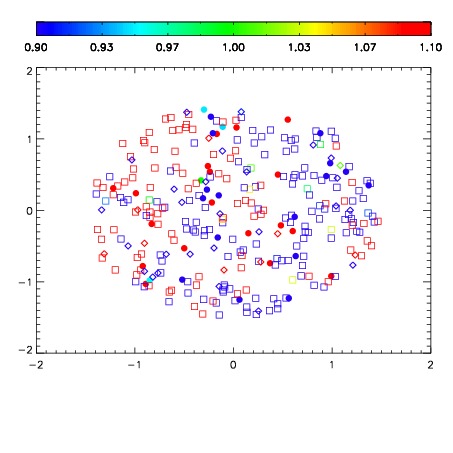


| Frame | Nreads | Zeropoints | Mag plots | Spatial mag deviation | Spatial sky 16325A emission deviations (filled: sky, open: star) | Spatial sky continuum emission | Spatial sky telluric CO2 absorption deviations (filled: H < 10) | |||||||||||||||||||||||
| 0 | 0 |
|
|
|
|
|
|
| IPAIR | NAME | SHIFT | NEWSHIFT | S/N | NAME | SHIFT | NEWSHIFT | S/N |
| 0 | 12590034 | 0.496298 | 0.00000 | 189.286 | 12590035 | 0.00194153 | 0.494356 | 188.677 |
| 1 | 12590033 | 0.494606 | 0.00169200 | 174.727 | 12590031 | 0.000508952 | 0.495789 | 180.875 |
| 2 | 12590030 | 0.489970 | 0.00632799 | 171.967 | 12590032 | 0.00132358 | 0.494974 | 179.973 |
| 3 | 12590029 | 0.488821 | 0.00747699 | 163.302 | 12590028 | 0.00000 | 0.496298 | 148.533 |