| Red | Green | Blue | |
| z | 17.64 | ||
| znorm | Inf | ||
| sky | -NaN | -Inf | -Inf |
| S/N | 24.3 | 41.9 | 45.1 |
| S/N(c) | 0.0 | 0.0 | 0.0 |
| SN(E/C) |
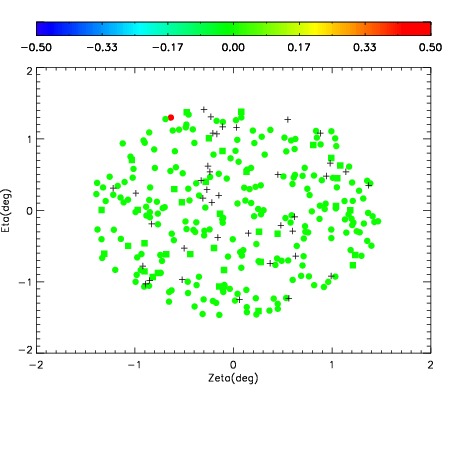
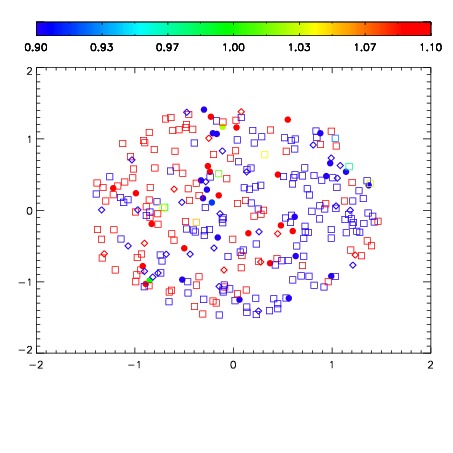
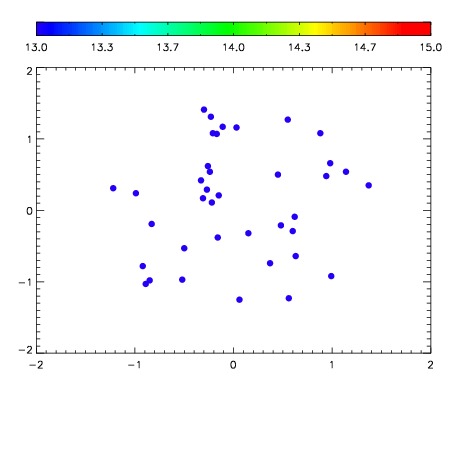

| Frame | Nreads | Zeropoints | Mag plots | Spatial mag deviation | Spatial sky 16325A emission deviations (filled: sky, open: star) | Spatial sky continuum emission | Spatial sky telluric CO2 absorption deviations (filled: H < 10) | |||||||||||||||||||||||
| 0 | 0 |
|
|
|
|
|
|
| IPAIR | NAME | SHIFT | NEWSHIFT | S/N | NAME | SHIFT | NEWSHIFT | S/N |
| 0 | 12610057 | 0.490764 | 0.00000 | 206.050 | 12610058 | -0.00222475 | 0.492989 | 209.408 |
| 1 | 12610052 | 0.489412 | 0.00135198 | 218.431 | 12610054 | -0.000736744 | 0.491501 | 218.783 |
| 2 | 12610056 | 0.490387 | 0.000376999 | 215.787 | 12610051 | 0.00000 | 0.490764 | 217.581 |
| 3 | 12610053 | 0.490750 | 1.39773e-05 | 214.533 | 12610055 | -0.000256228 | 0.491020 | 213.882 |