| Red | Green | Blue | |
| z | 17.64 | ||
| znorm | Inf | ||
| sky | -Inf | -Inf | -Inf |
| S/N | 27.2 | 43.9 | 45.8 |
| S/N(c) | 0.0 | 0.0 | 0.0 |
| SN(E/C) |
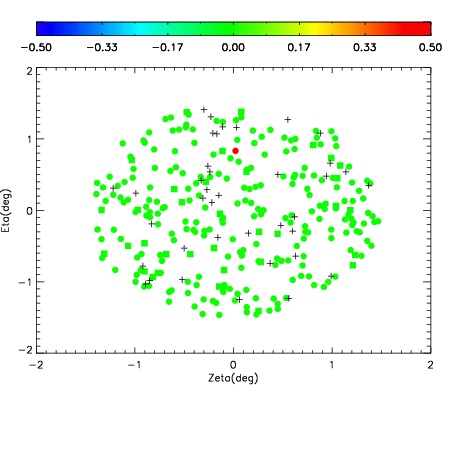
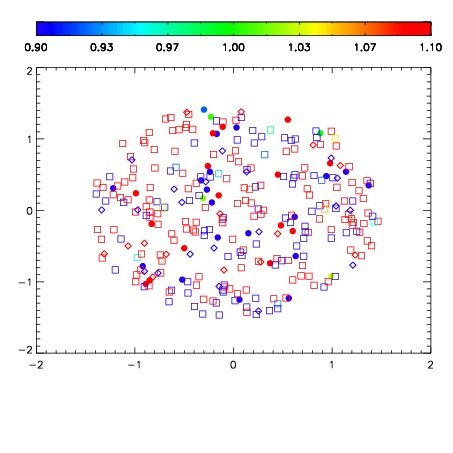
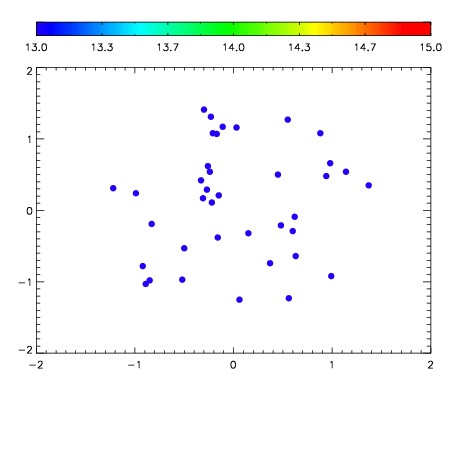

| Frame | Nreads | Zeropoints | Mag plots | Spatial mag deviation | Spatial sky 16325A emission deviations (filled: sky, open: star) | Spatial sky continuum emission | Spatial sky telluric CO2 absorption deviations (filled: H < 10) | |||||||||||||||||||||||
| 0 | 0 |
|
|
|
|
|
|
| IPAIR | NAME | SHIFT | NEWSHIFT | S/N | NAME | SHIFT | NEWSHIFT | S/N |
| 0 | 12670016 | 0.490799 | 0.00000 | 226.163 | 12670014 | -0.00219854 | 0.492998 | 222.959 |
| 1 | 12670017 | 0.490183 | 0.000616014 | 221.936 | 12670015 | -0.00143068 | 0.492230 | 219.943 |
| 2 | 12670012 | 0.488572 | 0.00222701 | 217.318 | 12670011 | 0.00000 | 0.490799 | 215.426 |
| 3 | 12670013 | 0.489502 | 0.00129700 | 212.101 | 12670018 | -0.00114648 | 0.491945 | 208.825 |