| Red | Green | Blue | |
| z | 17.64 | ||
| znorm | Inf | ||
| sky | -Inf | -Inf | -Inf |
| S/N | 22.4 | 39.0 | 41.5 |
| S/N(c) | 0.0 | 0.0 | 0.0 |
| SN(E/C) |
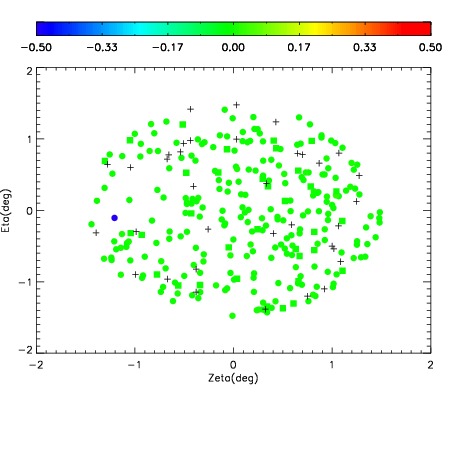
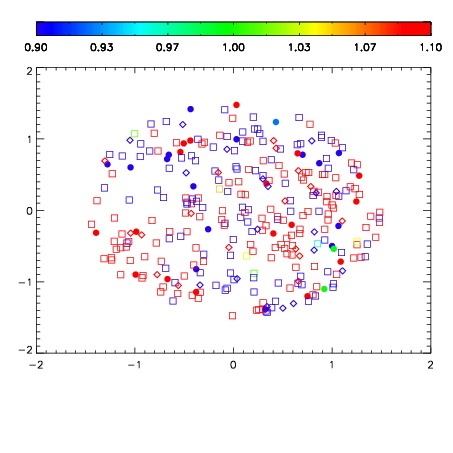
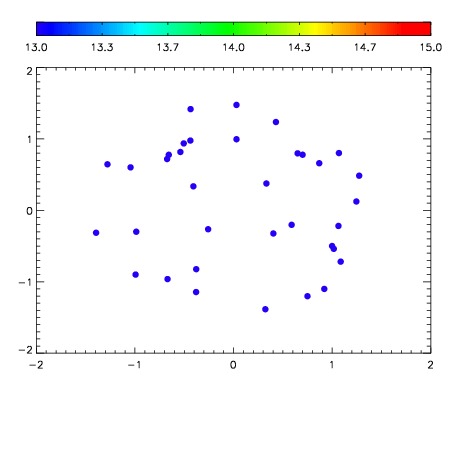

| Frame | Nreads | Zeropoints | Mag plots | Spatial mag deviation | Spatial sky 16325A emission deviations (filled: sky, open: star) | Spatial sky continuum emission | Spatial sky telluric CO2 absorption deviations (filled: H < 10) | |||||||||||||||||||||||
| 0 | 0 |
|
|
|
|
|
|
| IPAIR | NAME | SHIFT | NEWSHIFT | S/N | NAME | SHIFT | NEWSHIFT | S/N |
| 0 | 11870094 | 0.498849 | 0.00000 | 201.344 | 11870092 | 0.00000 | 0.498849 | 199.143 |
| 1 | 11870097 | 0.495744 | 0.00310501 | 222.611 | 11870096 | -0.00268066 | 0.501530 | 207.466 |
| 2 | 11870098 | 0.496588 | 0.00226101 | 217.233 | 11870099 | -0.000997222 | 0.499846 | 207.088 |
| 3 | 11870093 | 0.498236 | 0.000613004 | 200.111 | 11870095 | -0.00171619 | 0.500565 | 190.888 |