| Red | Green | Blue | |
| z | 17.64 | ||
| znorm | Inf | ||
| sky | -Inf | -Inf | -Inf |
| S/N | 20.5 | 38.6 | 40.0 |
| S/N(c) | 0.0 | 0.0 | 0.0 |
| SN(E/C) |

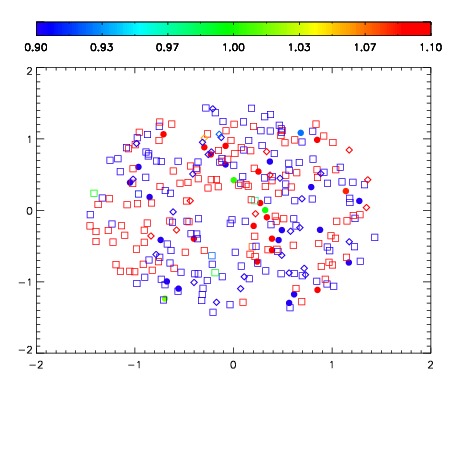
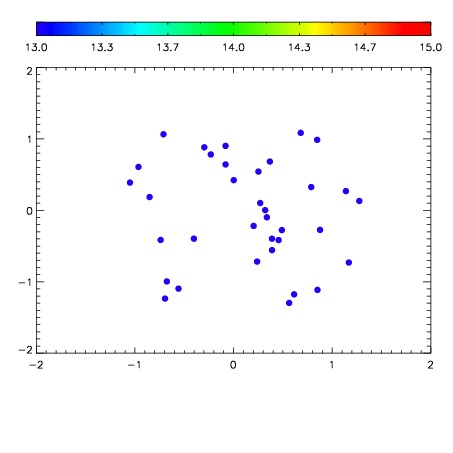

| Frame | Nreads | Zeropoints | Mag plots | Spatial mag deviation | Spatial sky 16325A emission deviations (filled: sky, open: star) | Spatial sky continuum emission | Spatial sky telluric CO2 absorption deviations (filled: H < 10) | |||||||||||||||||||||||
| 0 | 0 |
|
|
|
|
|
|
| IPAIR | NAME | SHIFT | NEWSHIFT | S/N | NAME | SHIFT | NEWSHIFT | S/N |
| 0 | 12460012 | 0.498301 | 0.00000 | 155.846 | 12460013 | -0.00208452 | 0.500386 | 152.789 |
| 1 | 12460019 | 0.492879 | 0.00542200 | 180.711 | 12460018 | -0.00230770 | 0.500609 | 174.832 |
| 2 | 12460015 | 0.494229 | 0.00407201 | 159.779 | 12460017 | -0.00151674 | 0.499818 | 162.831 |
| 3 | 12460011 | 0.497642 | 0.000658989 | 156.346 | 12460014 | -0.00242346 | 0.500724 | 158.774 |
| 4 | 12460016 | 0.495203 | 0.00309801 | 145.169 | 12460010 | 0.00000 | 0.498301 | 146.174 |