| Red | Green | Blue | |
| z | 17.64 | ||
| znorm | Inf | ||
| sky | -Inf | -Inf | -Inf |
| S/N | 26.2 | 38.2 | 45.9 |
| S/N(c) | 0.0 | 0.0 | 0.0 |
| SN(E/C) |
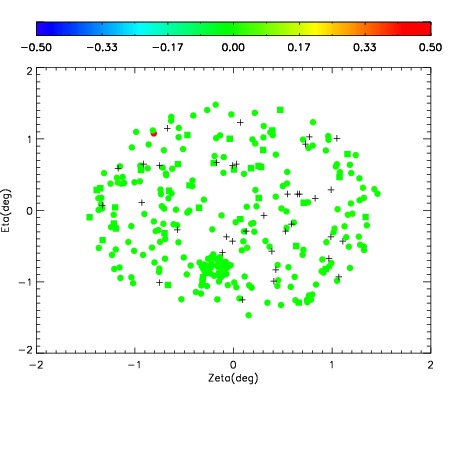
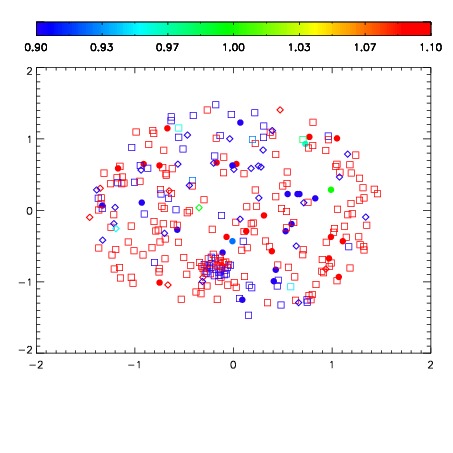
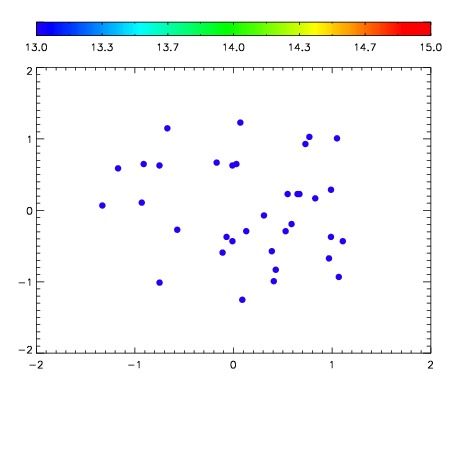

| Frame | Nreads | Zeropoints | Mag plots | Spatial mag deviation | Spatial sky 16325A emission deviations (filled: sky, open: star) | Spatial sky continuum emission | Spatial sky telluric CO2 absorption deviations (filled: H < 10) | |||||||||||||||||||||||
| 0 | 0 |
|
|
|
|
|
|
| IPAIR | NAME | SHIFT | NEWSHIFT | S/N | NAME | SHIFT | NEWSHIFT | S/N |
| 0 | 12310061 | 0.493927 | 0.00000 | 177.107 | 12310058 | -0.00103753 | 0.494965 | 179.260 |
| 1 | 12310060 | 0.493793 | 0.000133991 | 182.898 | 12310059 | -0.000981472 | 0.494908 | 186.907 |
| 2 | 12310057 | 0.493062 | 0.000865012 | 176.372 | 12310055 | 0.00000 | 0.493927 | 161.346 |
| 3 | 12310056 | 0.492633 | 0.00129402 | 175.817 | 12310062 | -0.000552833 | 0.494480 | 158.680 |