| Red | Green | Blue | |
| z | 17.64 | ||
| znorm | Inf | ||
| sky | -Inf | -Inf | -Inf |
| S/N | 21.7 | 35.4 | 36.3 |
| S/N(c) | 0.0 | 0.0 | 0.0 |
| SN(E/C) |
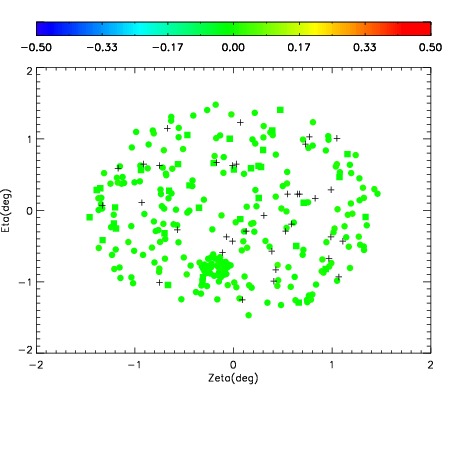
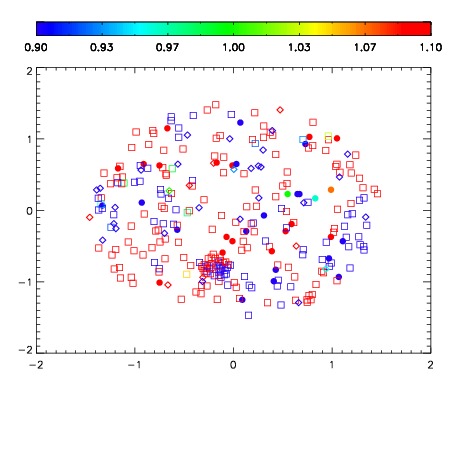
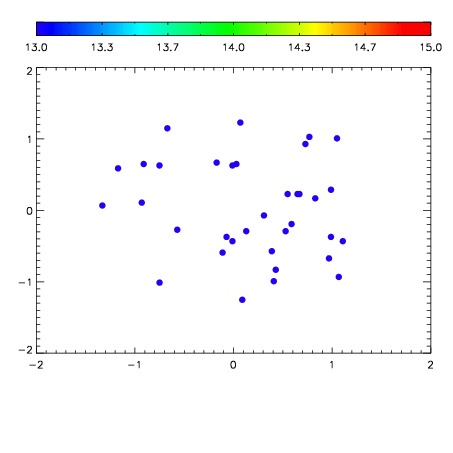

| Frame | Nreads | Zeropoints | Mag plots | Spatial mag deviation | Spatial sky 16325A emission deviations (filled: sky, open: star) | Spatial sky continuum emission | Spatial sky telluric CO2 absorption deviations (filled: H < 10) | |||||||||||||||||||||||
| 0 | 0 |
|
|
|
|
|
|
| IPAIR | NAME | SHIFT | NEWSHIFT | S/N | NAME | SHIFT | NEWSHIFT | S/N |
| 0 | 12350030 | 0.494908 | 0.00000 | 183.552 | 12350031 | -0.00156839 | 0.496476 | 155.978 |
| 1 | 12350029 | 0.494006 | 0.000901997 | 204.180 | 12350028 | 0.00179955 | 0.493108 | 185.849 |
| 2 | 12350026 | 0.492266 | 0.00264201 | 186.049 | 12350027 | 0.00183939 | 0.493069 | 162.451 |
| 3 | 12350025 | 0.491804 | 0.00310400 | 165.671 | 12350024 | 0.00000 | 0.494908 | 154.002 |
| 4 | 12350033 | 0.493926 | 0.000982016 | 134.484 | 12350032 | -0.00161578 | 0.496524 | 150.965 |