| Frame | Nreads | Zeropoints | Mag plots
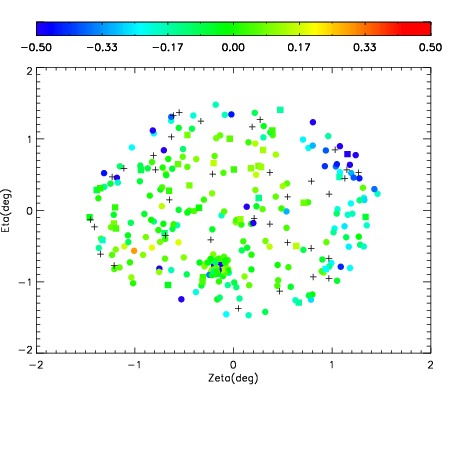
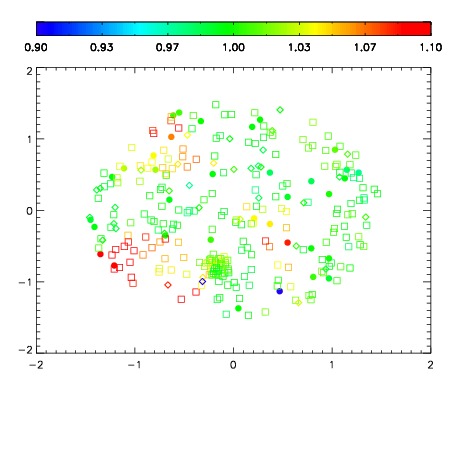
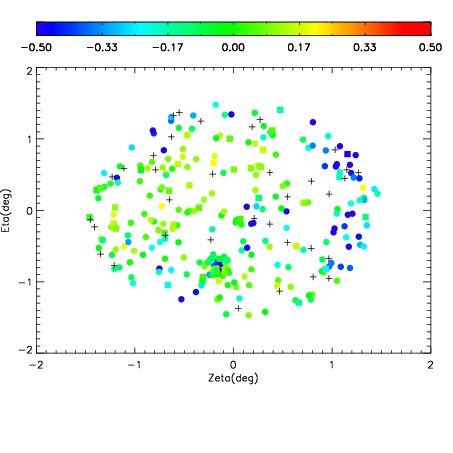
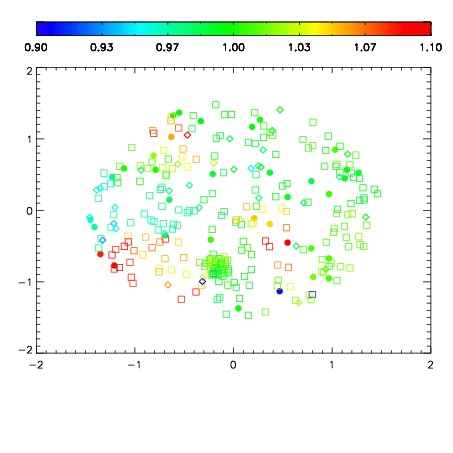
| Spatial mag deviation
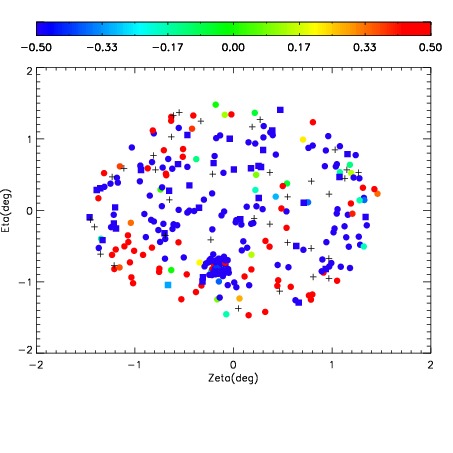
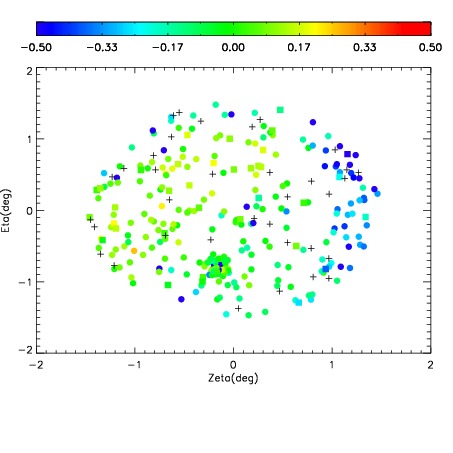
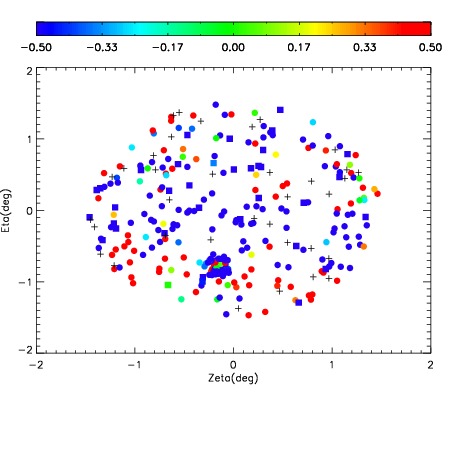
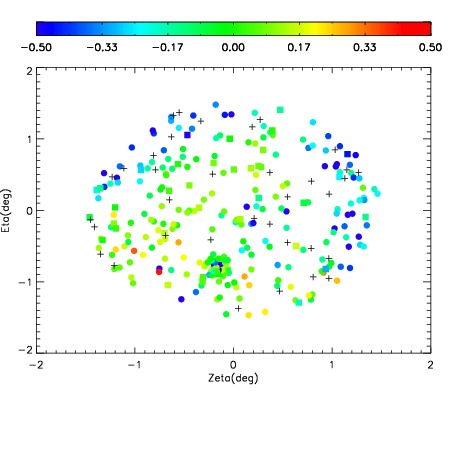
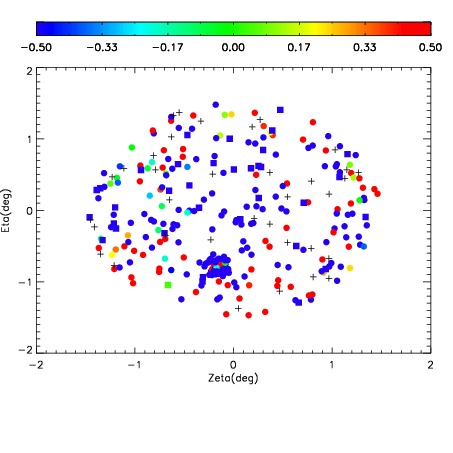
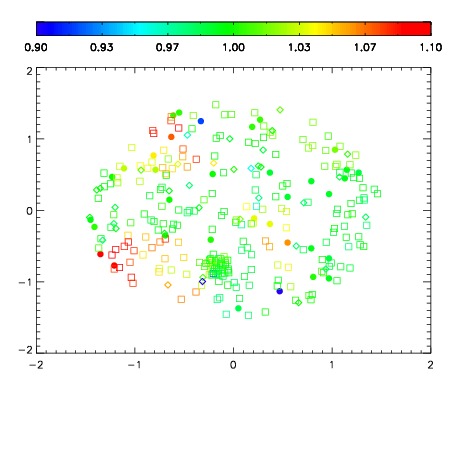
| Spatial sky 16325A emission deviations (filled: sky, open: star)
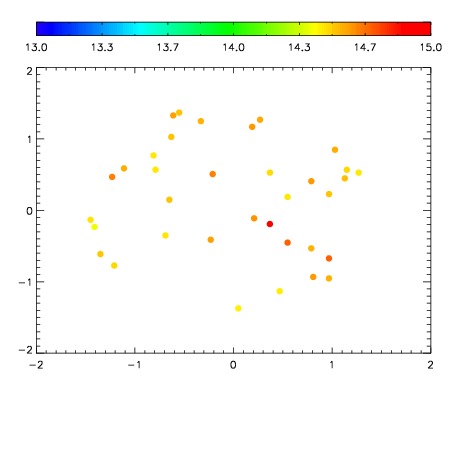
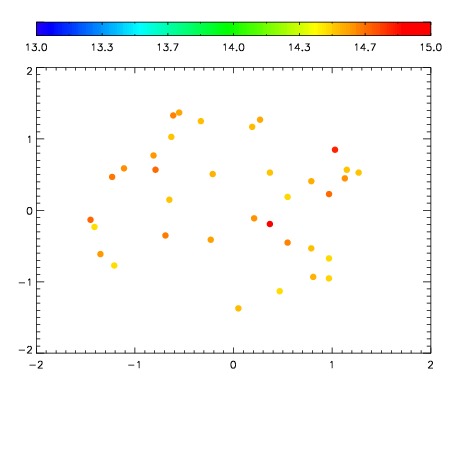
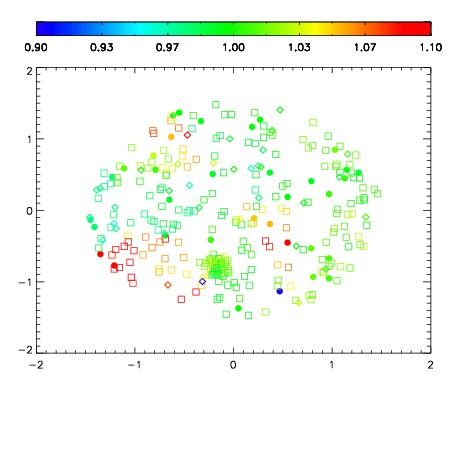
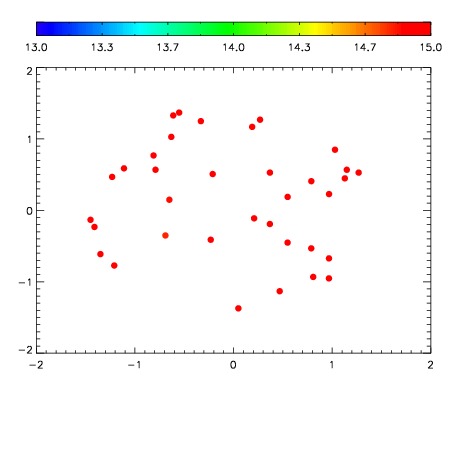
| Spatial sky continuum emission
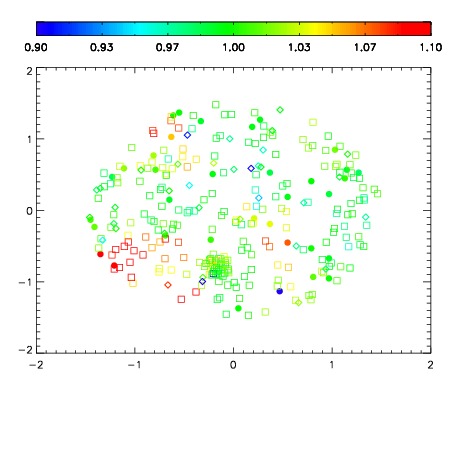
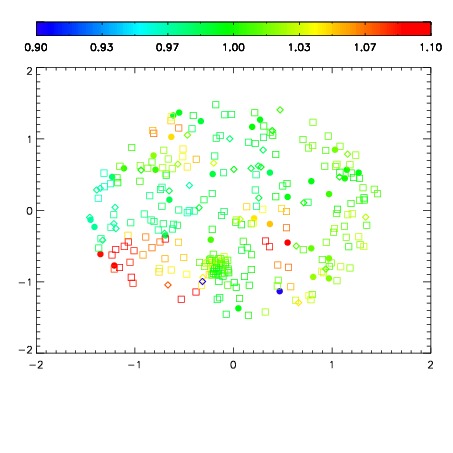
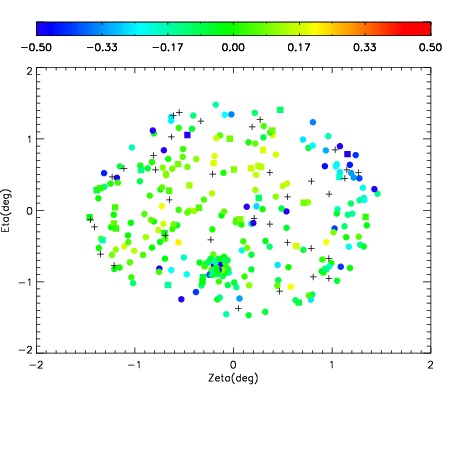
| Spatial sky telluric CO2 absorption deviations (filled: H < 10)
|
| 12220033
| 47
| | Red | Green | Blue
| | z | | 13.78
| | znorm | | 9.60
| | sky | 15.3 | 14.8 | 14.8
| | S/N | 0.2 | -0.1 | 0.5
| | S/N(c) | 0.0 | 0.0 | 0.0
| | SN(E/C) 1.45
|
| 
| 
| 
| 
| 
|
| 12220034
| 47
| | Red | Green | Blue
| | z | | 18.19
| | znorm | | 14.01
| | sky | 14.7 | 14.5 | 14.8
| | S/N | 8.3 | 15.5 | 15.8
| | S/N(c) | 7.1 | 13.5 | 13.9
| | SN(E/C) 0.87
|
| 
| 
| 
| 
| 
|
| 12220035
| 47
| | Red | Green | Blue
| | z | | 17.78
| | znorm | | 13.60
| | sky | 14.9 | 14.6 | 14.9
| | S/N | 5.6 | 11.2 | 10.9
| | S/N(c) | 4.9 | 10.0 | 9.4
| | SN(E/C) 0.92
|
| 
| 
| 
| 
| 
|
| 12220036
| 47
| | Red | Green | Blue
| | z | | 13.67
| | znorm | | 9.49
| | sky | 15.3 | 15.2 | 16.0
| | S/N | 0.0 | 0.2 | -0.0
| | S/N(c) | 0.0 | 0.0 | 0.0
| | SN(E/C) 1.33
|
| 
| 
| 
| 
| 
|
| 12220037
| 47
| | Red | Green | Blue
| | z | | 16.72
| | znorm | | 12.54
| | sky | 14.9 | 15.0 | 15.1
| | S/N | 2.0 | 4.5 | 4.2
| | S/N(c) | 1.8 | 3.9 | 4.0
| | SN(E/C) 0.93
|
| 
| 
| 
| 
| 
|
| 12220038
| 47
| | Red | Green | Blue
| | z | | 13.37
| | znorm | | 9.19
| | sky | 15.4 | 15.3 | 15.8
| | S/N | 0.1 | 0.3 | 0.1
| | S/N(c) | 0.0 | 0.0 | 0.0
| | SN(E/C) 1.94
|
| 
| 
| 
| 
| 
|
| 12220039
| 47
| | Red | Green | Blue
| | z | | 16.99
| | znorm | | 12.81
| | sky | 14.9 | 14.9 | 15.2
| | S/N | 3.0 | 6.9 | 6.5
| | S/N(c) | 2.7 | 6.1 | 5.8
| | SN(E/C) 1.07
|
| 
| 
| 
| 
| 
|
| 12220040
| 47
| | Red | Green | Blue
| | z | | 17.29
| | znorm | | 13.11
| | sky | 15.1 | 15.0 | 15.2
| | S/N | 3.5 | 8.0 | 7.4
| | S/N(c) | 3.1 | 7.0 | 6.7
| | SN(E/C) 0.92
|
| 
| 
| 
| 
| 
|