| Red | Green | Blue | |
| z | 17.64 | ||
| znorm | Inf | ||
| sky | -Inf | -NaN | -Inf |
| S/N | 24.8 | 41.9 | 44.4 |
| S/N(c) | 0.0 | 0.0 | 0.0 |
| SN(E/C) |

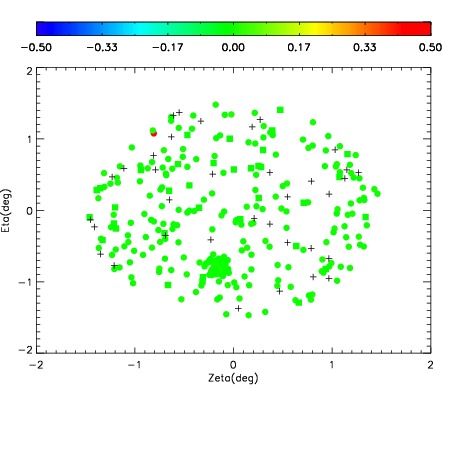
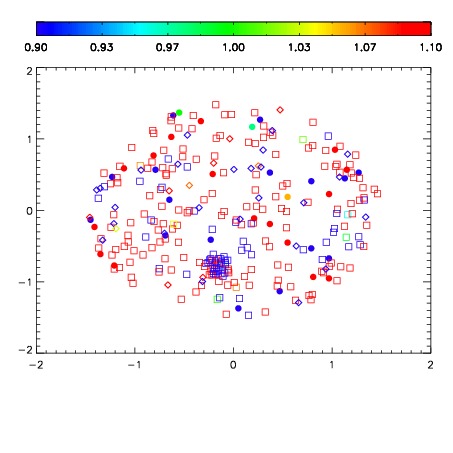
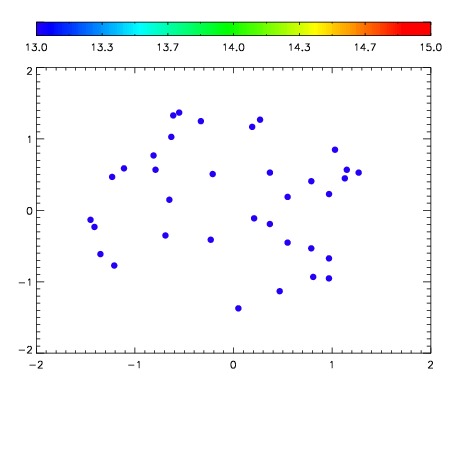

| Frame | Nreads | Zeropoints | Mag plots | Spatial mag deviation | Spatial sky 16325A emission deviations (filled: sky, open: star) | Spatial sky continuum emission | Spatial sky telluric CO2 absorption deviations (filled: H < 10) | |||||||||||||||||||||||
| 0 | 0 |
|
|
|
|
|
|
| IPAIR | NAME | SHIFT | NEWSHIFT | S/N | NAME | SHIFT | NEWSHIFT | S/N |
| 0 | 12230050 | 0.494971 | 0.00000 | 186.441 | 12230051 | 0.000406140 | 0.494565 | 186.519 |
| 1 | 12230049 | 0.494463 | 0.000508010 | 183.117 | 12230052 | 2.34544e-05 | 0.494948 | 185.849 |
| 2 | 12230053 | 0.494027 | 0.000944018 | 182.528 | 12230055 | -3.35589e-05 | 0.495005 | 185.385 |
| 3 | 12230054 | 0.493763 | 0.00120801 | 179.725 | 12230048 | 0.00000 | 0.494971 | 184.683 |